Ethanol or Alcohol (Ethyl alcohol), is a chemical that is extensively used in pharmaceuticals and commonly found in consumer products. Ethanol finds application in many formulations of products such as over-the-counter (OTC) products, skin disorder treatments, cosmetics and beauty products, and hand sanitizers and disinfectants.
It is crucial to monitor the quality of ethanol that finds its way into such products to protect human and animal health. This article presents an evaluation of trace level impurities that can be found in ethanol as per USP guidelines.
Herein the analysis of USP grade Ethanol as per the USP recommended condition and procedures is described. This is followed by the description of a modified procedure that generates excellent results with vastly improved data throughput and a considerable reduction in laboratory sample preparation time.
Instrumentation
The PerkinElmer Clarus® 690 GC with built-in autosampler was employed to conduct these experiments. Configuration of the Clarus 690 GC was in arrangement with a capillary injector and dual wide range flame ionization detector (FID).
A PerkinElmer Elite 624 and BAC-1 columns were installed in the injector via a two-hole ferrule or a “Y” splitter as displayed in Figure 1. Table 1 details the GC conditions necessary for the required analysis.
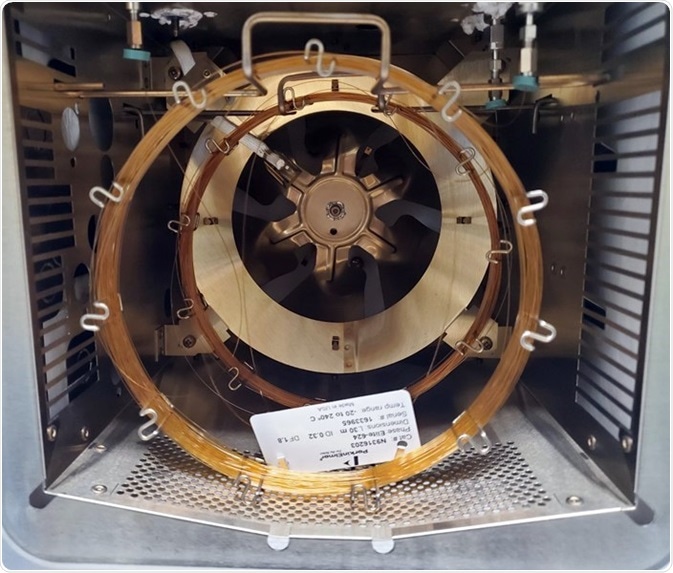
Figure 1. 30 m 0.32 mm Elite 624 and Elite-BAC columns used in this study. Image Credit: PerkinElmer
Table 1. Chromatography conditions. Source: PerkinElmer
| GC Parameters |
|
| Instrument |
PerkinElmer Clarus 690 GC |
| Carrier Gas |
Helium |
| Columns |
Elite-624 30 m 0.32 mm 1.8 µm N9316203
Elite-BAC1 30 m 0.32 mm 1.8 µm N9315071 |
| Column Pneumatics |
LCV: 35 cm/sec Split flow: 20 mL/min |
| Autosampler Parameters |
| Syringe size |
5 µL |
| Injection volume |
1 µL |
| Injection speed |
Normal |
| # of plunges |
8 |
| Pre-washes |
0 |
| Sample washes |
2 |
| Post washes |
4 |
| Viscosity delay |
0 |
| Injector Parameters |
| Injector |
Type: CAP Temp: 200 °C |
| Detector Parameters |
| Type |
WR-FID |
| Temperature |
230 °C |
| Range |
20 |
| Att |
-6 |
| Hydrogen |
30 mL/min |
| Air |
450 mL/min |
| Data rate |
12.5 pt/sec |
| Oven Parameters |
| Oven initial temperature |
40 °C |
| Oven initial hold |
12 minutes |
| Ramp Rate |
10 °C/minute |
| Final temperature |
240 °C |
| Final time |
10 minutes |
| Oven maximum |
260 °C |
| Equilibration time |
0 |
Experimental
Sample preparation
An aliquot of the Ethanol sample is dispensed into a 2 mL autosampler vial and positioned in place within the built-in autosampler of the Clarus 690 Gas Chromatograph (GC).
Standard preparation
The USP method of standardization for Ethanol uses an unconventional standard addition technique. The main benefit of the method is precise results without the need to use high purity solvents; the concept involves spiking the sample with a known amount of target analyte and comparing this peak area with the peak area of an unspiked sample. For example, Benzene:
Benzene calculation
Result = [BE /(BT- BE )] x CB
BE = Peak area of benzene from Sample solution A
BT = Peak area of benzene from Standard solution D
CB = Concentration of benzene in Standard solution D (µL/L)
The GC conditions, in accordance with the USP protocol, are displayed in Table 1. PerkinElmer has developed a much faster method as an alternative using the same columns as outlined in the ‘Alternate Method’ section later in this article.
Calibration
Ethanol
Each sample necessitates 6 chromatographic runs as follows:
Sample solution A: Alcohol (substance under test)
Sample solution B: 300 uL/L of 4-methylpentan-2-ol in
Sample solution A Standard solution A: 200 uL/L of methanol in Sample solution A
Standard solution B: 10 uL/L of methanol and 10 uL/L of acetaldehyde in Sample solution A
Standard solution C: 30 uL/L of acetal in Sample solution A
Standard solution D: 2 uL/L of Benzene in Sample solution A
For each analyte target the USP method requires different calculation equations and the sample passes if the result is “Not More Than” (NMT) the concentrations listed for Standard solutions above.
Methanol
Calculation Result = (Ru / Rs)
Ru = Peak area of methanol from Sample solution A
Rs = Peak area of methanol from Standard solution A
Benzene Calculation
Result = [BE /(BT- BE)] x CB
BE = Peak area of benzene from Sample solution A
BT = Peak area of benzene from Standard solution D
CB = Concentration of benzene in Standard solution D (µL/L)
Acetaldehyde Calculation (sum of acetaldehyde and acetal)
Result = {[AE /(AT-AE )] x CA} + {[DE /(DT-DE)] x CD x (MR1/MR2)}
AE = Peak area of acetaldehyde from Sample solution A
AT = Peak area of acetaldehyde from Standard solution B
CA = Concentration of acetaldehyde in Standard solution B( µL/L )
DE = Peak area of acetal from Sample solution A
DT = Peak area of acetal from Standard solution C
CD = Concentration of acetal in Standard solution C ( µL/L )
MR1 = Molecular weight of Acetaldehyde, 44.05
MR2 = Molecular weight of Acetal, 118.2
Any other impurity calculation
Result = (Ru /Rm) x Cm
Ru = Peak area of each impurity in Sample solution B
Rm = Peak area of 4-methylpentan-2-ol in Sample solution B
Cm = Concentration of 4-methylpentan-2-ol in Sample solution B (µL/L)
Results and Discussion
Since there are numerous organic compounds, and many co-elute, dual column confirmation was employed to inhibit the reporting of false negatives, in accordance with USP for the conformation of benzene.
The forensic industry employs this method for blood alcohol evaluation to support compound identification. The USP method utilizes a G43 (common name 624) phase as the reporting column for results and allows for a column of different polarity stationary phase for the confirmatory column.
The BAC 1 phase was selected for its chromatographs and capacity to separate these compounds effectively. Additionally, it has been investigated thoroughly by the forensics industry as the reporting column for blood alcohol investigation. Ethanol was run spiked and unspiked as outlined below in Figure 2 to 7.
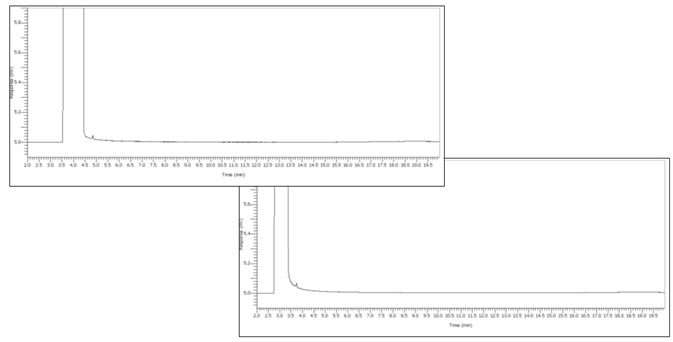
Figure 2. Ethanol sample under test. Image Credit: PerkinElmer

Figure 3. 300 μL/L 4-Methylpentan-2-ol spike. Image Credit: PerkinElmer
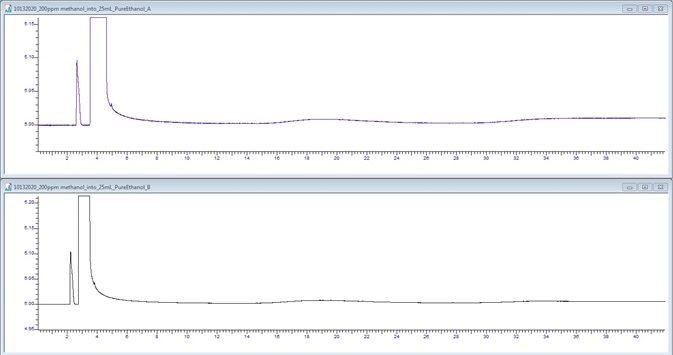
Figure 4. 200 μL/L Methanol spike. Image Credit: PerkinElmer
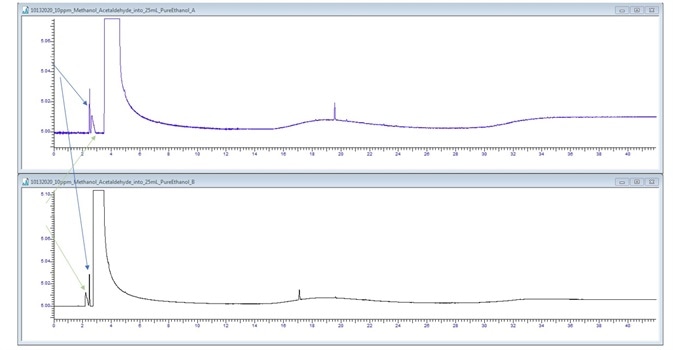
Figure 5. 200 μL/L Methanol and Acetaldehyde spike. Image Credit: PerkinElmer
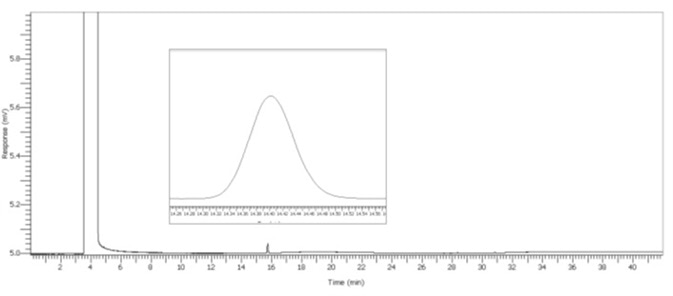
Figure 6. 30 μL/L Acetal spike. Image Credit: PerkinElmer
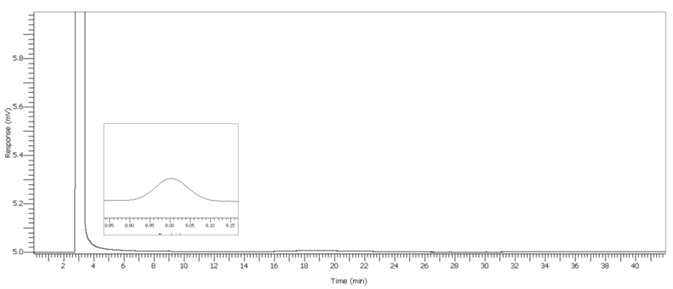
Figure 7. 2 μL/L Benzene spike. Image Credit: PerkinElmer
An Ethanol sample of unknown history passed the USP criteria easily as displayed in Table 2.
Table 2. Calculation of impurities in Ethanol. Source: PerkinElmer
| Name |
Acetaldehyde |
Methanol |
Benzene |
Acetal |
4-methyl-2-pentanol |
| area [µV·s] |
area [µV·s] |
area [µV·s] |
area [µV·s] |
area [µV·s] |
| Ethanol Blank A |
0 |
0 |
3.1 |
0 |
0 |
| 300 ppm 4-methyl-2-pentanol |
0 |
0 |
0.8 |
0 |
2763.4 |
| 200 ppm methanol |
0 |
336.1 |
4.3 |
0 |
0 |
| 10 ppm methanol/acetaldehyde |
96 |
15 |
2.3 |
0 |
0 |
| 30 ppm acetal |
0 |
0 |
1.5 |
164.4 |
0 |
| 2 ppm benzene |
0 |
0 |
22.4 |
0 |
0 |
| Ethanol Blank B |
0 |
0 |
0.7 |
0 |
0 |
| Acceptance Limit (NMT) |
10 |
200 |
2 |
300 |
| Ethanol Sample A results |
0 |
0 |
0.32 |
0 |
5.54 |
Table 3. USP impurities in Ethanol, action limits (NMT) and repeatability. Source: PerkinElmer
| Ethanol |
| Compound |
Action Limit (µL/L) |
Precision % RSD |
| Acetaldehyde |
10 |
1.3 |
| Methanol |
200 |
1.3 |
| Benzene |
2 |
1.9 |
| Acetal |
30 |
1.3 |
| 4-Methyl-2-Pentanol |
300 |
1.4 |
Summary
As demonstrated above, the PerkinElmer dual-column FID Clarus 690 GC analyzed impurities in Ethanol efficiently and effectively using the USP method with outstanding accuracy and selectivity for alcohols typically found in the manufacturing of hand sanitizer by USP methodology.
Alternate method
Alternate introduction
The analysis of Ethanol by the USP method as detailed above is in good working order and produces good results. There are a few items that could be improved upon in order to increase lab productivity.
Alternate experimental
The configuration of the instruments is identical as described vide supra.
The chromatography column and condition are only modified for improved data quality and speed of analysis but are otherwise similar to the above official USP conditions. The modified parameters are outlined below in Table 4.
Table 4. Alternate instrument parameters. Source: PerkinElmer
| GC Parameters |
| Instrument |
PerkinElmer Clarus 690 GC |
| Carrier Gas |
Helium |
| Columns |
Elite-624 30 m 0.32 mm 1.8 µm N9316203
Elite-BAC1 30 m 0.32 mm 1.8 µm N9315071 |
| Column Pneumatics |
LCV: 35 cm/sec Split flow: 20 mL/min |
| Autosampler Parameters |
| Syringe size |
5 µL |
| Injection volume |
1 µL |
| Injection speed |
Normal |
| # of plunges |
6 |
| Pre-washes |
2 |
| Sample washes |
2 |
| Post washes |
2 |
| Viscosity delay |
0 |
| Injector Parameters |
| Injector |
Type: CAP Temp: 200 °C |
| Detector Parameters |
| Type |
WR-FID |
| Temperature |
230 °C |
| Range |
20 |
| Att |
-6 |
| Hydrogen |
30 mL/min |
| Air |
450 mL/min |
| Data rate |
12.5 pt/sec |
| Oven Parameters |
| Oven initial temperature |
40 °C |
| Oven initial hold |
5 minutes |
| Ramp rate |
70 °C/minute |
| Final temperature |
230 °C |
| Final time |
1 minute |
| Oven maximum |
230 °C |
| Equilibration time |
0 |
Alternate method results and discussion
Alternate method standard combined all individual standards into a combined stock standard as displayed in Figure 9. External single point standardization was employed on each of the components and the subsequent results were quantified using the USP calculations, vide supra.
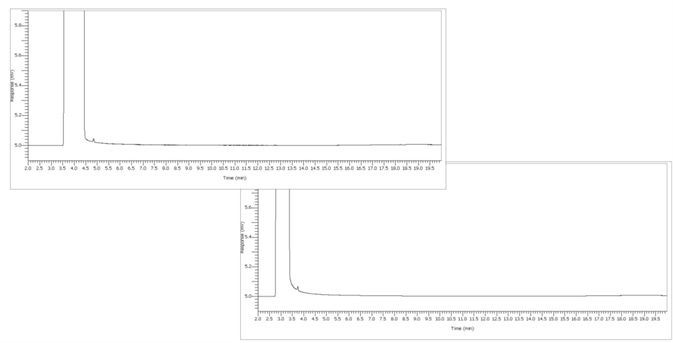
Figure 8. Ethanol test sample under alternate conditions. Image Credit: PerkinElmer

Figure 9. USP impurities Standards at Action Limits. Image Credit: PerkinElmer
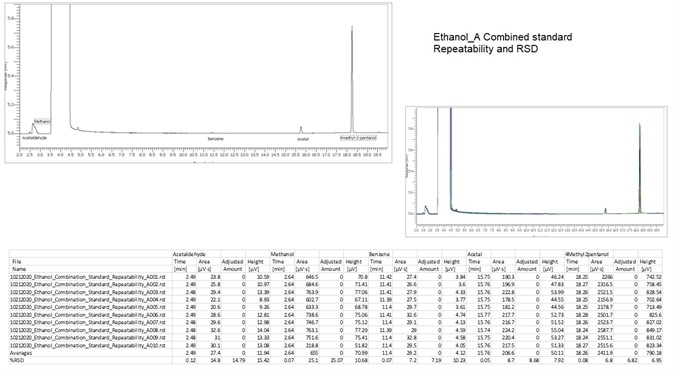
Figure 10. Combined Standard G43 column. Image Credit: PerkinElmer
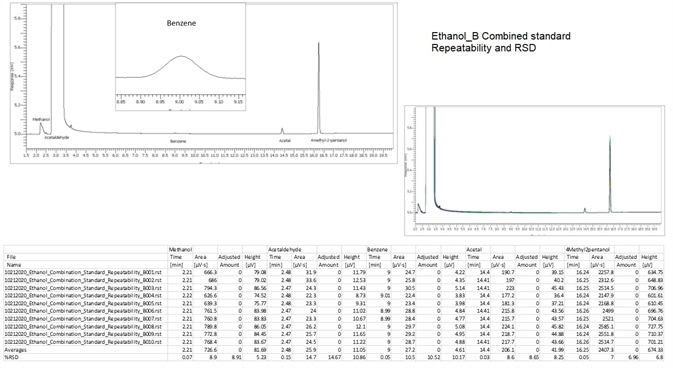
Figure 11. Combined Standard BAC-1 column. Image Credit: PerkinElmer
Figure 8 shows an unknown Ethanol that was processed and the results are detailed in Figures 10 and 11.
Table 6. % RSD of ethanol impurities. Source: PerkinElmer
| Ethanol |
| Compound |
Precision % RSD (n=8) |
| Acetaldehyde |
0.78 |
| Methanol |
1.17 |
| Benzene |
1.32 |
| Acetal |
0.97 |
| 4-Methyl-2-Pentanol |
0.92 |
If benzene happens to be detected, it is necessary to rerun the sample with a different polarity column to verify that the peak is indeed benzene, not a co-eluting nontarget. The configuration employed in this study analyzes all target through each column sets, thus eliminating the need to remove columns and/or rerunning samples with positive benzene results.
Figure 12 displays benzene on two different polarities columns.
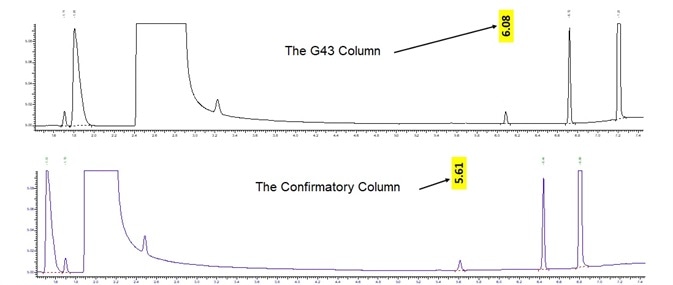
Figure 12. Benzene confirmation on G43 vs BAC-1. Image Credit: PerkinElmer
Summary
The alternate method can speed-up the USP run time from 260 minutes to less than 7.5 minutes with an improvement greater than 28-fold in total. The modified method also significantly reduces the time needed for sample preparation, therefore saving both time and money.
The user can select either the standard or the faster alternate method for the identification of impurities in USP grade Ethanol by simply selecting the method appropriate for data acquisition. Outstanding precision and accuracy are accomplished using either mode.
About PerkinElmer
As a global technology leader, PerkinElmer is taking action to harness the power of insights and transform them into knowledge to deliver innovative, differentiated solutions for our customers.
Sponsored Content Policy: News-Medical.net publishes articles and related content that may be derived from sources where we have existing commercial relationships, provided such content adds value to the core editorial ethos of News-Medical.Net which is to educate and inform site visitors interested in medical research, science, medical devices and treatments.