Green fluorescent protein (GFP) is widely used in molecular and cell biology as a reporter gene for expression of proteins. GFP is an intrinsically fluorescent protein that is easily detected using a fluorometer or fluorescence microscope and benefits from high quantum yield, low toxicity to cells and high photostability. The major benefit of this reporter system however is that it is heritable, allowing for the continued study of cells and tissues in which it is expressed.
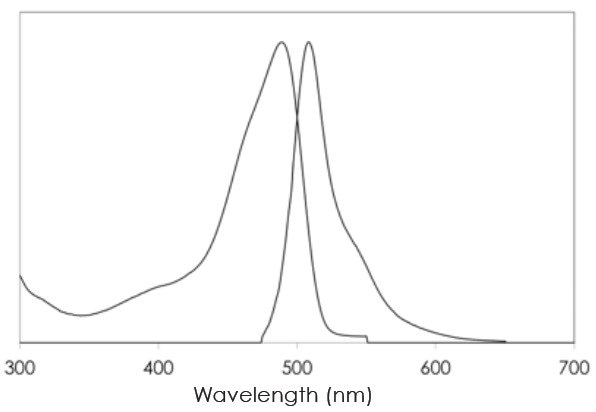
Enhanced GFP (EGFP) is a GFP isoform that is optimized to exhibit improved spectral characteristics for use with mammalian cells. In this article, data was collected using this isoform, which has an excitation maximum and an emission maximum at 488 nm and 508 nm respectively (Figure 1).

Figure 1. Excitation and emission spectra of EGFP. Image credit: DeNovix
Employing a proprietary optical core and the versatility of four fluorescence channels, the DeNovix DS-11 FX+ and QFX series of fluorometers allow measurement of a wide range of fluorophores. This article will demonstrate precise and sensitive quantification of EGFP. Fluorescence apps preconfigured in DeNovix’ EasyApps® software allow the researcher to access commonly used assays quickly and easily.
Custom methods can also be created for DNA, RNA, protein and other types of assays. The user can determine the optimum fluorescence channel by using an LED Wizard in the assay creation window of the apps.
DS 11 Series | Spectrophotometer | Fluorometer
Materials
EGFP was fluorescently quantified on a DeNovix QFX fluorometer using the BioVision GFP Quantitation Kit. A 200 μL total assay volume was prepared in 0.5 mL, thin-wall PCR tubes.
To make 1 μg/μL EGFP standard solution, the provided standard was reconstituted in 100 μL of assay buffer. This standard solution was diluted to 10 ng/μL working solution, which, in turn was diluted 10-fold for a high sensitivity standard curve. The Pierce BCA Protein colorimetrics assay was used to determine the actual EGFP concentration of the standard.
Methods
Solutions containing total EGFP concentrations ranging from 0 to 5 ng/μL were gravimetrically prepared by serial dilution from the working solution. Based upon the gravimetric dilutions, the predicted concentrations of all samples were calculated. Two standard curves were prepared according to the BioVision protocol for accuracy in both a broad range and a higher sensitivity range.
The BioVision microplate protocol was adapted for the 200 μL minimum volume needed for the QFX fluorometer. A custom method employing the blue optical path was created to determine EGFP fluorescence, using the Fluoro Standard Assays app on the QFX.
The peak excitation wavelength of the blue channel is 470 nm, and the excitation filter wavelength range includes the EGFP excitation maximum of 488 nm. Concentrations between 0.25 ng/μL and 5 ng/μL were measured using the broad sensitivity standard curve, and the GFP concentrations between 0 and 0.25 ng/μL were measured using the high sensitivity standard curve.
Performance data
Broad sensitivity data
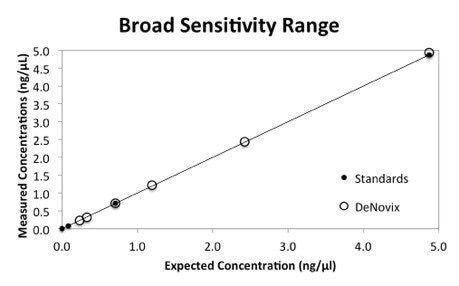
Figure 2 graphically shows the broad sensitivity standard curve. The same performance data is given in tabular form in Table 1. All data represents the average of three replicate measurements.

Figure 2. Broad sensitivity GFP standard curve. Image credit: DeNovix
Table 1. Broad sensitivity GFP performance data
|
Expected GFP
|
Broad Sensitivity Curve
|
|
ng/μL
|
ng/μL
|
StDev
|
|
0.232
|
0.231
|
0.005
|
|
0.33
|
0.323
|
0.003
|
|
0.71
|
0.718
|
0.011
|
|
1.19
|
1.214
|
0.030
|
|
2.42
|
2.439
|
0.048
|
|
4.87
|
4.931
|
0.042
|
High sensitivity data
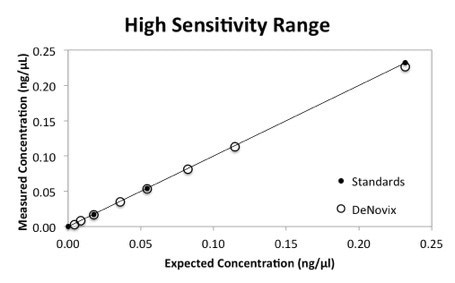
Figure 3 and Table 2 present the high sensitivity standard curve and the corresponding data.

Figure 3. High sensitivity GFP standard curve. Image credit: DeNovix
Table 2. High sensitivity GFP performance data
|
Expected GFP
|
High Sensitivity Curve
|
|
ng/μL
|
ng/μL
|
StDev
|
|
0.004
|
0.003
|
0.0005
|
|
0.008
|
0.009
|
0.002
|
|
0.018
|
0.016
|
0.004
|
|
0.036
|
0.035
|
0.011
|
|
0.054
|
0.053
|
0.011
|
|
0.082
|
0.081
|
0.016
|
|
0.115
|
0.113
|
0.019
|
|
0.232
|
0.226
|
0.068
|
Conclusion
The DeNovix QFX Fluorometer enables the accurate and precise quantification of EGFP through the entire range of the BioVision GFP Quantification Kit. Using a combination of a broad range and a high sensitivity curve, an EGFP concentration range of 0.004 to 4.87 ng/µL was reliably detected.
Equivalent fluorescence performance is also available using the DS-11 FX+ that combines microvolume absorbance measurements with high sensitivity fluorescence.
Other resources
About DeNovix, Inc.
WELCOME TO DENOVIX
Award-Winning products for Life Science
Our multi-award winning products include the Reviewers’ Choice Life Science Product of the Year and Platinum Seal awarded- DS-11 Series Spectrophotometer / Fluorometer and CellDrop™ Automated Cell Counter. CellDrop is the first instrument of its kind to Count Cells Without Slides. These powerful instruments integrate patented DeNovix technology with easy-to-use software designed by life scientists for life scientists.
Researchers tell us they love the industry leading performance, smart-phone-like operation, and the flexible connectivity of the instruments. When support is needed, the DeNovix team is here to help. DeNovix received the prestigious Life Sciences Customer Service of the Year based on independent reviews posted by scientists worldwide!
CellDrop: Sustainable laboratory product of the year
The CellDrop Automated Cell Counter has been awarded Sustainable Laboratory Product of the Year in the SelectScience® Scientists’ Choice Awards®!
CellDrop’s patented DirectPipette™ technology distinguishes it as the only cell counter to eliminate the need for cell counting slides. This innovation saves millions of single-use plastic slides from use and disposal each year.
Sponsored Content Policy: News-Medical.net publishes articles and related content that may be derived from sources where we have existing commercial relationships, provided such content adds value to the core editorial ethos of News-Medical.Net which is to educate and inform site visitors interested in medical research, science, medical devices and treatments.