Sponsored Content by RefeynReviewed by Olivia FrostJul 17 2024
Mass photometry is a popular and robust analytical tool that facilitates the accurate mass measurement of single molecules in solution, in their native state and without the use of labels.

Image Credit: Dark Gel
The studies presented in this article compare the use of mass photometry to size exclusion chromatography (SEC) - the industry’s gold standard - for the analysis of protein abundance and antibody aggregation.
As complementary analytical tools, mass photometry and size exclusion chromatography (SEC) can be used to gain detailed and abundant information on the biophysical and biochemical properties of biomolecules within a given sample.
There are a number of important considerations to be aware of when comparing the two techniques’ resulting datasets, however, and these are also explored in this article.
Mass photometry and SEC data will be compared via two case studies: one which showcases the two techniques’ ability to quantify the relative abundance of each protein in a sample mixture across a wide mass range and another that looks at how the techniques can be employed in the characterization of antibody aggregation.
Case study 1: Assessing protein abundance within a sample mixture
Figure 1 highlights the inherent differences between SEC and mass photometry via the analysis of a sample mixture comprising four different proteins. These analyses were performed by the laboratory of Professor Justin Benesch (University of Oxford), and all make use of SEC-UV and mass photometry,
An identical sample mix was used for both the SEC- UV and mass photometry measurements in this instance, but there is an obvious disagreement between the techniques in terms of which proteins are the most abundant within the mixture.
SEC-UV suggests that thyroglobulin and ferritin are the most abundant in this example, while mass photometry suggests that conalbumin and aldolase are the most abundant. To properly understand this discrepancy, it is important to consider the fundamental principles of each technique and its use.
Fundamental principles of mass photometry versus SEC
As a single molecule technique, mass photometry provides a particle count versus mass. This means that it detects and counts the number of particles of a given mass.
Essentially, the intensity of a given mass photometry peak (the area underneath the peak) corresponds to the absolute number of molecules with the given mass that were detected, and this measurement is also proportional to the molecular concentration.
SEC-UV analysis works by measuring UV absorbance versus column elution time. Assuming they are known, it is possible to convert data to absorbance versus mass using the species’ molecular weights. This approach is also based on the fact that the species of the greatest hydrodynamic volume typically elutes first.
However, it is important to note that absorbance data is not just a function of the molecule’s concentration; this will also depend on the molecule’s UV-absorbing properties. Data in this instance will also be impacted by the specifications of the UV detector itself, such as its sensitivity at a specific UV wavelength.
In cases where the molar extinction coefficient of each molecule is known, it is possible to determine each molecule’s concentration within a mixed sample by evaluating the absorbance data using the Beer-Lambert law.
Mass photometry agrees with normalized SEC-UV analysis
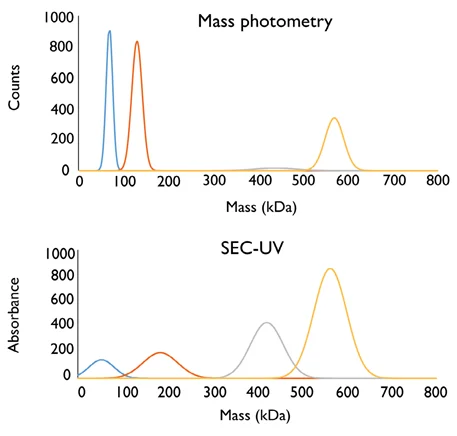
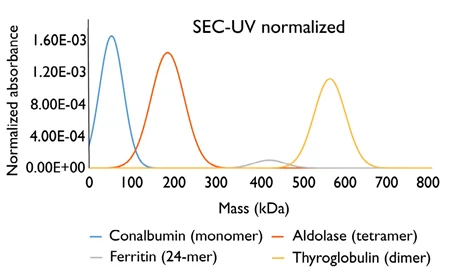
Figure 1. Analysis of the same sample by mass photometry and SEC-UV illustrates fundamental differences between the techniques. The sample analyzed contained a mixture of four proteins: conalbumin, aldolase, ferritin and thyroglobulin. The molecular weights of each protein within the mixture were known and used to convert the SEC-UV profile from absorbance vs. elution time to absorbance vs. mass. The molar extinction coefficients of each protein were used to normalize the absorbance data. Image Credit: Refeyn Ltd.
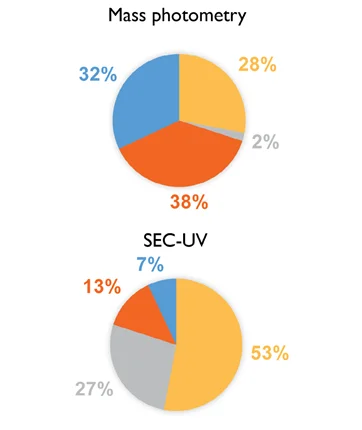
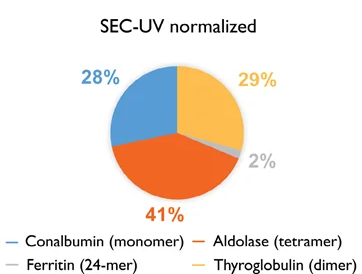
Figure 2. Abundance (%) of each protein within a sample mixture as determined by mass photometry and SEC-UV. For mass photometry, the number of counts for each molecule is expressed as a percentage of the total number of counts. For SEC-UV, the relative abundances of each molecule are shown before (SEC-UV) and after (SEC-UV normalized), normalizing for the molar extinction coefficient. Image Credit: Refeyn Ltd.
Using this approach with each individual protein in the sample will result in a normalized SEC-UV data profile that will visually match the corresponding mass photometry data (Figure 1). Quantification of the relative abundance of each protein will also confirm that the results of SEC-UV and mass photometry are in close agreement (Figure 2).
Case study 2: Monitoring aggregation levels of monoclonal antibodies
Many protein-based biopharmaceuticals rely on aggregation to function in terms of their product efficacy and safety, including monoclonal antibodies (mAbs) and multi-specific antibodies. It is essential that proper monitoring of aggregation levels is performed when developing and evaluating these biopharmaceuticals.
SEC is commonly regarded as the gold-standard analytical tool for the assessment of nanometer-sized aggregates. SEC is regularly used in conjunction with multi-angle light scattering (MALS) in cases where it is necessary to determine molecular weight and size. However, this technique can be complicated by a number of factors, including column and mobile phase optimization.
Mass photometry works by detecting the light scattered by single molecules, allowing the efficient measurement of biomolecules’ molecular mass in solution. This technique is capable of analyzing exceptionally small (µL) sample volumes at low concentrations (100 pM up to 100 nM) in just a few minutes while maintaining native conditions.
The example study presented here was conducted by RIC Biologics (Kortrijk, Belgium). SEC and mass photometry were employed in the measurement of aggregation levels of samples of trastuzumab (a monoclonal antibody) and a number of trastuzumab biosimilars.
Trastuzumab is a humanized IgG1 monoclonal antibody with the potential to inhibit HER2 signaling pathways and activate antibody-dependent cell-mediated cytotoxicity. This monoclonal antibody is employed in cancer treatment where there is an overexpression of the HER2 cell surface receptor.
Several trastuzumab biosimilars have been developed in recent years, with chromatography techniques at the forefront of assessing crucial quality attributes during biosimilar development, most notably aggregation.
This case study confidently demonstrates that SEC and mass photometry are complementary techniques while further highlighting mass photometry’s usefulness as an orthogonal technique in monitoring aggregation in biopharmaceuticals such as mAbs.
Experimental methods
An Agilent Technologies 1260 Bio-inert HPLC Infinity II system was used to perform both SEC and SEC-MALS measurements. This system was equipped with a diode-array detector (DAD) and was coupled to both a refractive index (RI) detector and a Wyatt miniDAWN multi-angle light scattering detector.
Sample compounds were initially separated in line with their hydrodynamic radius under native conditions using an SEC column. Detection was then completed consecutively using a DAD, MALS detector, and RI detector.
Utilizing the DAD or RI signals as a concentration source, it was possible to use the light scattering data from multiple detector angles to ascertain the molecular weight (MW) of analyte peaks. Sample load was increased to 315 µg in this instance in order to enable accurate MW determination of the protein aggregates.
A TwoMP system was used to acquire mass photometry data, with measurements performed of both the interference between the scattered light from individual sample molecules and the reflected light of the glass slide measurement surface.
The resulting signal (the interferometric contrast) is directly correlated with molecular mass, meaning that it is simple to convert this using protein standards of known MW.
A comprehensive overview of the experimental conditions and instrumentation used is provided in Tables 1 and 2.
Table 1. Experimental conditions for SEC-MALS. Source: Refeyn Ltd.
| SEC-MALS |
| System |
Agilent Technologies 1260 Bio-inert HPLC Infinity II with RI detector and Wyatt miniDAWN MALS detector |
| Column |
Waters XBridge Protein BEH SEC Column 200Å (7.8 x 300 mm x 3.5 μm) |
| Temperature |
22°C |
| Mobile phase |
0.2 M sodium phosphate, pH 7.0 |
| Flow rate |
0.8 mL/min |
| Run time (Elution time) |
24 min |
| Injection |
10 μg (SEC), 315 μg (SEC-MALS) |
| DAD Detection |
| Wavelength |
280 nm (band width 4 nm, no reference wavelength) |
| Peak Width |
> 0.2 min (1.25 Hz) |
| R1 Detection |
| Temperature |
35°C |
| Peak Width |
> 0.025 min (18.5 Hz) |
| Data processing |
| Software |
OpenLAB CDS ChemStation and ASTRA V8 |
Table 2. Experimental conditions for mass photometry. Source: Refeyn Ltd.
| Mass photometry |
| System |
TwoMP |
| Temperature |
Room temperature (21°C) |
| Dilution solvent |
PBS |
| Sample concentration (and mass of antibody per sample measurement) |
20 nM (30 ng) |
| Sample carrier slides |
Cleaned using water and 2-propanol |
| Run time (Detection time) |
1 min |
| Data processing |
| Software |
DiscoverMP |
Interpretation of SEC data
Trastuzumab-producing Chinese hamster ovary cell (CHO) clone supernatant samples were purified using Protein A affinity chromatography, and these were then analyzed via SEC.
Figure 3 displays SEC chromatograms of the trastuzumab originator (Herceptin®, essentially the reference product or ‘parent molecule’) and a total of four selected CHO clones.
There are clear differences in both the high MW and low MW areas. These can be distinguished by examining the left and right of the main monomer peak, respectively. In this case, the primary high MW peak is associated with a dimer of trastuzumab, which is especially pronounced in clones 3 and 10.
Table 3 shows the relative peak areas for both monomer and dimer species obtained via the SEC-UV chromatogram). These are the key molecules of interest in this example.
An SEC-MALS experiment was run for Herceptin® and CHO clone 10 (Figure 4) to obtain an MW estimation. The latter displayed a MW of 146.5 kDa for the monomer and 295.5 kDa for the dimer, values which show good agreement with the MW of the originator’s concurring peaks.
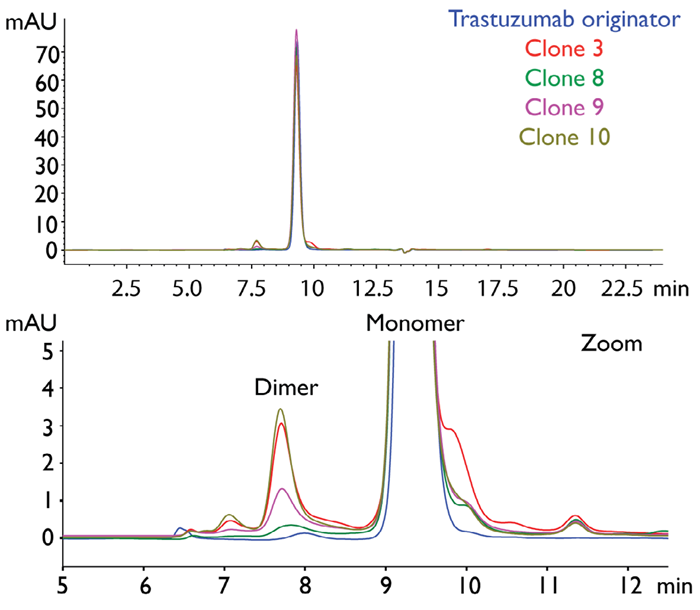
Figure 3. SEC-UV chromatograms of trastuzumab originator (Herceptin®) and trastuzumab-producing CHO clones (UV 280 nm). Image Credit: Refeyn Ltd.
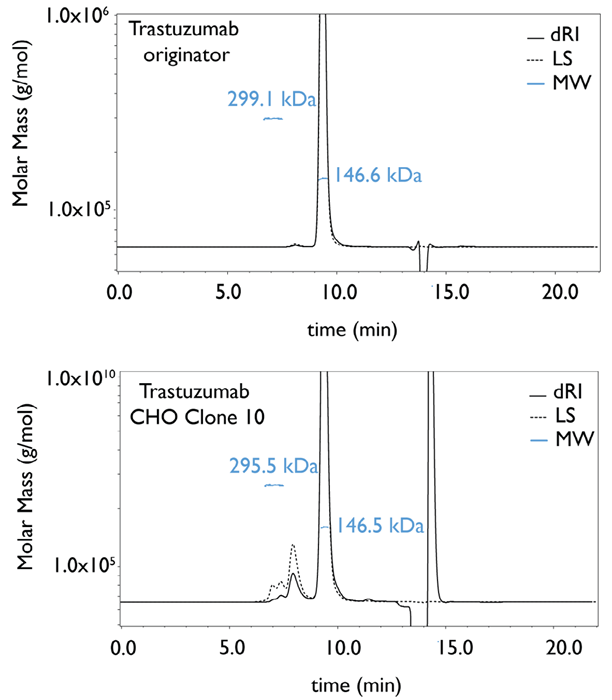
Figure 4. Molecular weight determination by SEC-MALS of monomer and dimer peak for trastuzumab originator (Herceptin®) and trastuzumab-producing CHO clone 10 (dRI: differential refractive index, LS: light scattering, MW: molecular weight). Image Credit: Refeyn Ltd.
Denaturing SEC-mass spectrometry analysis showed that noncovalent dimers are present in CHO clone 10, whereas covalently bound dimers are found in the originator product.1 This also explains the retention time difference between dimer peaks observed in the clones versus the originator.
Trastuzumab sample analysis by mass photometry
Each sample was also analyzed using mass photometry and measured at a final concentration of 10 nM (Figure 5).
Calibrants were used in the form of albumin, α-mannosidase and thyroglobulin, meaning that it was possible to directly interpolate the MW from the data. The MW of the trastuzumab monomer was measured as 155 kDa, and the MW of the dimer was measured as 300 kDa, values of which are both consistent with those determined using SEC-MALS.
Monomer and dimer peaks are defined as the 120–190 kDa and 280–350 kDa mass intervals, respectively. This was done to enable accurate analysis of the mass photometry datasets and to ensure consistency.
Calculations of the percentage abundance of each species were performed by determining the number of counts (within the pertinent defined mass interval) as a proportion of the total count number.
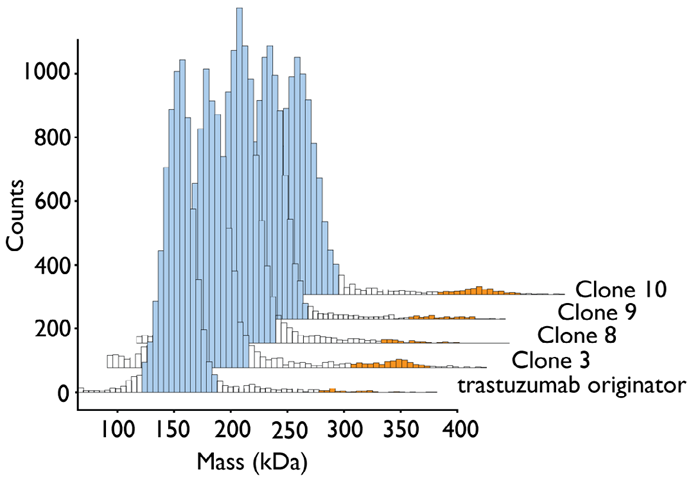
Figure 5. Mass photometry mass histogram of trastuzumab originator (Herceptin®) and trastuzumab-producing CHO clones. Monomer peaks are highlighted in blue, dimer peaks in orange. Image Credit: Refeyn Ltd.
Normalizing SEC-UV data
A comparison of percentage abundance for the monomer and dimer from SEC-UV (Table 3) and mass photometry (Table 5) illustrates that the data is broadly in agreement. Clones 3 and 10 were found to contain the greatest abundance of dimers in relation to the predominant monomeric species.
However, it is necessary to include a correction step to ensure a true quantitative comparison.
When investigating biotherapeutic proteins like trastuzumab, the DAD detector response at 280 nm is principally related to the number of tyrosine and tryptophan residues contained within.
When dimers are formed, a higher number of absorbing residues will be present per molecule with respect to the monomer. This impacts the peak height (detector response) and, in turn, the peak area.
In the example presented here, the Beer-Lambert law was employed in the conversion of measured peak heights in the SEC chromatogram to analyte concentration [g/liter]. A correction factor for the UV flow cell was also applied.
The concentration was then converted into molar concentration [mol/liter] using the MW of the monomer and dimer species, respectively. Table 4 provides a useful overview of both the monomer and dimer abundance for every sample, following the normalization of absorbance for the molar extinction coefficient.
Table 3. Monomer and dimer abundance from SEC-UV chromatograms. To calculate the percentage abundance of both monomer and dimer, the individual peak area for each was calculated and expressed as a percentage of the total/combined peak area. Source: Refeyn Ltd.
| |
Sample |
trastuzumab originator |
Clone 3 |
Clone 8 |
Clone 9 |
Clone 10 |
| Abundance (%) |
Monomer |
99.6 |
94.9 |
99.0 |
97.7 |
94.7 |
| Dimer |
0.4 |
5.1 |
1.0 |
2.3 |
5.3 |
Table 4. Monomer and dimer abundance after normalizing SEC-UV absorbance data. Source: Refeyn Ltd.
| |
Sample |
trastuzumab originator |
Clone 3 |
Clone 8 |
Clone 9 |
Clone 10 |
| Abundance (%) |
Monomer |
99.9 |
97.7 |
99.8 |
99.2 |
97.6 |
| Dimer |
0.1 |
2.3 |
0.2 |
0.8 |
2.4 |
Table 5. Monomer and dimer abundance determined by mass photometry. The 120 –190 kDa mass interval defines the monomer peak and the 280 – 350 kDa mass interval, the dimer peak. Percentage abundance of each species is expressed as a proportion of the total number of counts. Source: Refeyn Ltd.
| |
Sample |
trastuzumab originator |
Clone 3 |
Clone 8 |
Clone 9 |
Clone 10 |
| Abundance (%) |
Monomer |
99.3 |
96.8 |
98.8 |
98.7 |
97.1 |
| Dimer |
0.7 |
3.2 |
1.2 |
1.3 |
2.9 |
Conclusion
Biopharmaceuticals’ product safety and efficacy rely on the proper analysis of the protein aggregates contained therein. Widely regarded as a gold standard technique in this sector, SEC enables the robust determination of protein aggregation, whereby molecular separation is dependent on the difference in hydrodynamic radius.
When coupled to a MALS detector, SEC can be used to identify both the size and molecular weight of analytes, with an analysis run-time of just 30 minutes.
Mass photometry can be used to analyze samples under native conditions within one minute. This analytical technique works by interpreting light-scattering data from individual analyte molecules approaching the glass slide interface.
As the underlying detection principle of each of these methods is fundamentally different, a number of factors must be taken into account when comparing data from both. This is especially important when quantitatively assessing the relative abundance of different molecules in a sample mixture.
In order to properly account for these differences, measured peak area absorbance values must be normalized by converting to molar concentration. By doing so, it is possible to gain an unbiased comparison of samples analyzed by SEC and mass photometry.
Case Study 1 illustrated this with a simple protein mix example, while Case Study 2 explored this further using an example of several trastuzumab biosimilars.
In both cases, SEC and mass photometry were found to provide comparable results. Where there were differences in the data captured by both techniques, it is most likely that these relate to the parameters and/or criteria used for peak integration.
For example, if the monomer-dimer ratio is concentration-dependent when working with trastuzumab biosimilars, differences in the concentration of antibody sample used for SEC versus mass photometry would also affect the relative abundance of monomer versus dimer.
Due to the complexity of biopharmaceuticals such as monoclonal antibodies, it is often necessary to use several analytical tools to provide detailed insight into their efficacy and safety.
As shown in this article, mass photometry and SEC data – for a simple protein mixture, as well as several trastuzumab biosimilars – are in agreement. This confirms and highlights the usefulness and legitimacy of mass photometry as an orthogonal analytical technique.
References
- Liesa Verscheure, Gerd Vanhoenacker, Sonja Schneider, Tom Merchiers, Julie Storms, Pat Sandra, Frederic Lynen, and Koen Sandra, Analytical Chemistry 2022 94 (17), 6502-6511
Acknowledgments
Produced from materials originally authored by Refeyn Ltd.
About Refeyn Ltd.
Refeyn are the innovators behind mass photometry, a novel biotechnology that allows users to characterise the composition, structure and dynamics of single molecules in their native environment. We are producing a disruptive generation of analytical instruments that open up new possibilities for research into biomolecular functions.
Spun out of Oxford University in 2018 by an experienced team of scientific professionals, Refeyn aims to transform bioanalytics for scientists, academic researchers, and biopharma companies around the world.
Sponsored Content Policy: News-Medical.net publishes articles and related content that may be derived from sources where we have existing commercial relationships, provided such content adds value to the core editorial ethos of News-Medical.Net which is to educate and inform site visitors interested in medical research, science, medical devices and treatments.