Sponsored Content by RefeynReviewed by Olivia FrostJul 22 2024
This article outlines and explores the use of mass photometry for detection. It also summarizes the most common errors that can adversely affect mass photometry measurements, supporting users in the acquisition of the highest-quality results.

Image Credit: stock_wichel
Mass photometry is a widely used, label-free, single-molecule analysis technique that works by detecting the light scattered by a single particle at a glass-water interface.
A single protein exhibits a weak scattering signal, but this is quantified against an orders-of-magnitude stronger background signal from reflection at the interface.
Mass photometry data is returned as a series of images (Figure 1). For each image, the average of N frames is taken and divided by the average of the N subsequent frames to illustrate the amount of signal change observed when a molecule lands on the glass surface.
The signal generated by a single molecule is known to scale linearly with the molecule’s mass, so standard samples with previously recorded molecular masses can be used to calibrate the mass to the signal. Due to this, mass photometry is able to accurately measure mass, even when working with unknown samples.
Noise sources in mass photometry
Mass photometry is limited by shot noise originating from the quantum nature of the light. This limitation results in random fluctuations in the number of photons arriving at the detector, a limitation that is further compounded by the reflection at the glass surface, generating an inhomogeneous image.
These two factors represent the primary source of signal variation (Figure 1), with background fluctuations originating from mechanical vibrations or drift in the lateral stage position also impacting data quality.
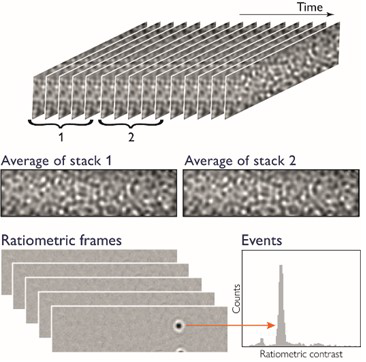
Figure 1. Generation of the mass photometry signal. Images of the glass surface, taken over time, are divided into two stacks of N consecutive frames (typically N=5). These stacks are averaged to calculate a single ratiometric frame. The process is repeated for stacks of frames shifted by one frame at a time, generating a ratiometric movie. The signals from molecules landing on the glass surface throughout the movie contribute to the MP histogram. Image Credit: Refeyn Ltd.
Single-molecule detection
Single molecules will produce features in ratiometric images as they interact with the glass surface. As these molecules are much smaller than the wavelengths typically used for imaging, they will be represented as a point-spread function (PSF) (Figure 2) in most instances.
The PSF defines the imaging system’s response to a point source, which will depend on the objective lens’s numerical aperture (NA) and the imaging wavelength employed. The higher the NA and the shorter the wavelength, the smaller the PSF of the device.
If the same instrument is used to measure molecules of different masses, the PSFs will have identical shapes but varying intensities (Figure 2). For example, thyroglobulin possesses a mass ten times greater than bovine serum albumin (BSA), so its signal intensity will be ten times stronger.
Several hundreds of molecule-glass landing events can be detected during a 1-minute acquisition, affording users direct information on the molecular mass distribution of a sample containing both molecule types (Figure 2).
Events must be well separated in terms of time and space to avoid fitting errors due to overlapping PSFs that may obscure the desired results. Sample concentration must, therefore, be maintained at a level that allows single molecule detection (generally <100 nM). This is why mass photometry measurements typically require very low sample volumes.
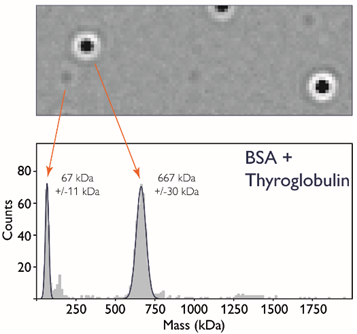
Figure 2. Single molecule detection with mass photometry. Upper panel: a single ratiometric frame of a mixture of BSA and thyroglobulin, showing PSFs with different intensities. Lower panel: a mass histogram. An MP movie recorded for one minute typically consists of 6000 frames, during which several hundreds of molecules can be detected as they land on the glass surface. From the resulting series of ratiometric frames, a mass histogram can be created. Image Credit: Refeyn Ltd
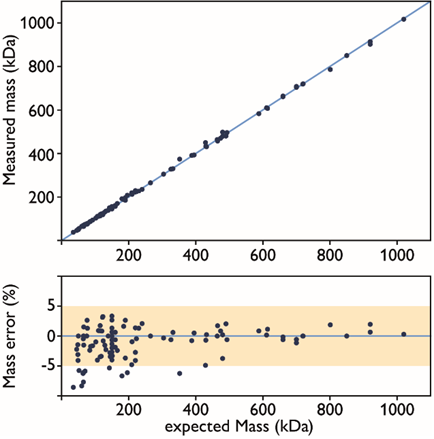
Figure 3. Accuracy of mass photometry measurements. Upper panel: correlation of expected vs measured molecular mass (in kDa) of molecules. Lower panel: mass error shown as a percentage of the expected mass (N=150). Image Credit: Refeyn Ltd.
Accuracy
Peaks in a mass photometry histogram can be fitted using Gaussian approximations. The peak center represents the measured mass of the species in these instances.
Mass measured by mass photometry can be found to deviate from the anticipated mass due to a number of factors; for example, errors in measurement, calibration and fitting.
These errors are generally within 5 % of the expected mass, however (Figure 3), meaning that it is possible to improve accuracy by repeating an experiment and averaging errors of individual experiments to gain an improved estimation of the calibration error.
Detection range
Noise levels in the ratiometric image will impact the user’s ability to accurately detect and quantify PSFs. Averaging an increased number of frames in order to calculate each image in the ratiometric movie will reduce the shot-noise-induced fluctuations in each ratiometric image, therefore increasing the signal-to-background ratio and allowing for the detection of lower mass molecules.
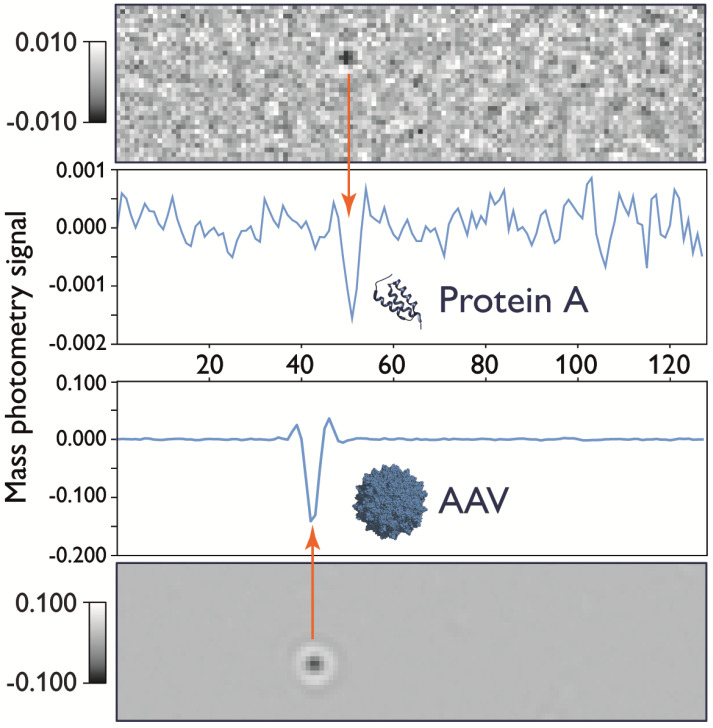
Figure 4. Mass photometry signal scales with particle size. Signal traces of landing events for protein A (42 kDa, upper panel) and an adeno-associated virus (AAV) particle (5 MDa, lower panel) are depicted. Image Credit: Refeyn Ltd.
There is a notable downside to averaging more frames, however, as this will lead to reduced temporal resolution. In this case, it may be necessary to decrease protein concentrations in order to prevent PSFs from overlapping.
Longer averaging times may also hinder data quality due to lateral drift, meaning that in order to achieve accurate measurement of molecules with a mass close to the detection limit, averaging more frames may be necessary (while still paying attention to drift).
As larger molecules yield a stronger signal, these do not need as much frame averaging. The mass range that can be accommodated by mass photometry is clearly demonstrated by measurements of protein A (42 kDa) and an AAV particle (-3.7 MDa). As these samples possess almost 100 times greater mass, they will generate a signal with almost 100 times greater intensity (Figure 4).
Resolution
Resolution can be understood as the minimum separable distance between peaks in a multi-peak distribution. In this context, resolution is directly related to the width of individual peaks.
Standard deviation is generally -10 % of the mass in these scenarios, as indicated by the center of the peak. Resolution is also highly dependent on sample purity and composition, as well as on the relative concentrations of the species present.
It is possible to resolve two peaks when the separation between their centers is larger than the sum of their full width at half maximum (FWHM), assuming these have equal peak heights.
Where proteins exhibit low mass, mass photometry enables the separation of peaks that differ by only -25 kDa (BSA and protein A) (Figure 5). Where proteins exhibit greater mass (thyroglobulin, 670 kDa), the resolvable distance would increase to -85 kDa due to thyroglobulin’s larger FWHM (which partially stems from the presence of a high level of glycosylation).
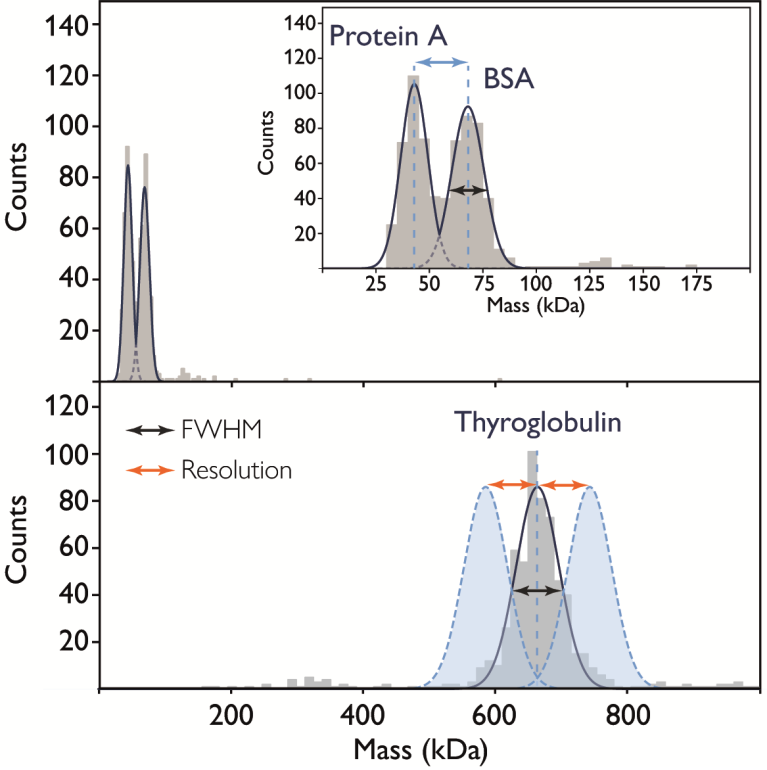
Figure 5. Resolution and full width at half maximum. Top: the mass histogram for a 1:1 mixture of protein A (42 kDa) and BSA (66 kDa). Inset: the FWHM (black arrow) indicates the resolving power, allowing for clear peak separation (blue arrow). Bottom: thyroglobulin (670 kDa, glycosylated) with FWHM (black arrow) indicated. Theoretical Gaussians (blue) indicate possible resolution (orange arrows), assuming similar peak heights (i.e. numbers of events). Image Credit: Refeyn Ltd.
Acknowledgments
Produced from materials originally authored by Refeyn Ltd.
About Refeyn Ltd.
Refeyn are the innovators behind mass photometry, a novel biotechnology that allows users to characterise the composition, structure and dynamics of single molecules in their native environment. We are producing a disruptive generation of analytical instruments that open up new possibilities for research into biomolecular functions.
Spun out of Oxford University in 2018 by an experienced team of scientific professionals, Refeyn aims to transform bioanalytics for scientists, academic researchers, and biopharma companies around the world.
Sponsored Content Policy: News-Medical.net publishes articles and related content that may be derived from sources where we have existing commercial relationships, provided such content adds value to the core editorial ethos of News-Medical.Net which is to educate and inform site visitors interested in medical research, science, medical devices and treatments.