This article is based on a poster originally authored by Anna-Mari Kärkkäinen, Riikka Immonen, Leena Rauhala, Artem Shatillo, and Susanne Bäck.
Animal models are critical in improving our understanding of neuropathic pain processes, enabling the discovery and development of new pain management medicines.
This study evaluated behavioral, biomarker, and imaging readouts in the mouse spared nerve injury (SNI) model of neuropathic pain. The work was performed to validate the model and identify readouts that could be employed in future drug development studies to investigate the efficacy of potential therapeutics.
This study used funtional ultrasound imaging (fUS) the animal’s central nervous system as an exploratory, novel readout—fUS is a noninvasive and sensitive functional neuroimaging technique with great spatial and temporal resolution.
It is suitable for use in minimally anesthetized mice, can characterize illness models in acute and chronic phases, and is used for efficacy and target engagement studies.
Methods
Animals and surgery:
The animal work followed the European Union Directive 2010/63 and was approved by the national Project Authorization Board. SNI was induced in male and female C57Bl6/J mice according to Decosterd and Woolf (Pain, 2000). Under isoflurane anesthesia, the right tibia and common peroneal nerves were dissected, with a tiny section removed distal to the sciatic nerve furcation. Control animals were subjected to mock surgery, which exposed the nerves while leaving them intact.
In-vivo readouts:
- Tactile and cool allodynia were assessed using electronic von Frey and acetone cooling tests.
- IconeusOne fUS imaging was utilized to assess tactile sensory processing in the somatosensory cortex after pinprick stimulation of the plantar paw with a spinal needle (22G × 2 1/2 - 0.70 × 63 mm). Imaging was performed under anesthesia with 0.05 mg/kg dexmedetomidine (0.15 mg/kg/h, 2 ml/kg, 6 ml/kg/h) and 1 mg/kg atipamezole.
Ex-vivo readouts:
- Neurofilament light chain (NfL): Analyzed NfL plasma levels using Quanterix Simoa.
- Intraepidermal nerve fiber (IENF) analysis: PGP9.5 immunohistochemistry was used to quantify IENF terminals in skin punch samples collected on day seven after SNI.
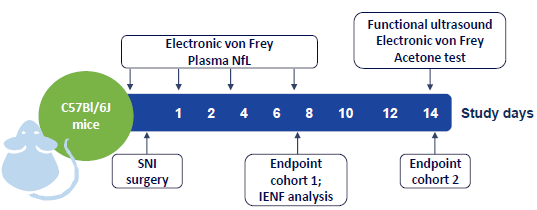
Figure 1. Study outline. Image Credit: Charles River Laboratories.
Results
Acute tactile allodynia during the first week after SNI surgery
![Tactile allodynia up to one week after sham or SNI surgery in mice. Tactile sensitivity normalized to the pre-surgery (BL) sensitivity [% of BL paw withdrawal threshold (PWT)]. A: Tactile allodynia in sham and SNI groups at different timepoints. Data shown as group mean ± SD. Statistically significant differences: **** p < 0.0001 vs. BL. (2- way ANOVA, Dunnett’s post hoc) #### p < 0.0001 vs. sham (Sidak’s post hoc). B: Tactile sensitivity of the contralateral paw. Data shown as group mean ± SD. No statistically significant differences.](https://www.news-medical.net/images/Article_Images/ImageForArticle_25390_17298494577806657.png)
Figure 2. Tactile allodynia up to one week after sham or SNI surgery in mice. Tactile sensitivity normalized to the pre-surgery (BL) sensitivity [% of BL paw withdrawal threshold (PWT)]. A: Tactile allodynia in sham and SNI groups at different time points. Data shown as group mean ± SD. Statistically significant differences: **** p < 0.0001 vs. BL. (2-way ANOVA, Dunnett’s post hoc) #### p < 0.0001 vs. sham (Sidak’s post hoc). B: Tactile sensitivity of the contralateral paw. Data shown as group mean ± SD. No statistically significant differences. Image Credit: Charles River Laboratories.
SNI-evoked changes in plasma NfL levels and paw skin IENF
![Plasma NfL levels before (BL) and 1, 3, and 7 days after surgery. Data presented as group mean [pg/mL] ± SEM. Significant differences: **** p < 0.0001 vs. BL. #### p < 0.0001 vs. Sham. n (Sham males) = 3, n (Sham females) = 3, n (SNI males) = 3, n (SNI females) =10.](https://www.news-medical.net/images/Article_Images/ImageForArticle_25390_17298494675892938.png)
Figure 3. Plasma NfL levels before (BL) and 1, 3, and 7 days after surgery. Data presented as group mean [pg/mL] ± SEM. Significant differences: **** p < 0.0001 vs. BL. #### p < 0.0001 vs. Sham. n (Sham males) = 3, n (Sham females) = 3, n (SNI males) = 3, n (SNI females) =10. Image Credit: Charles River Laboratories.
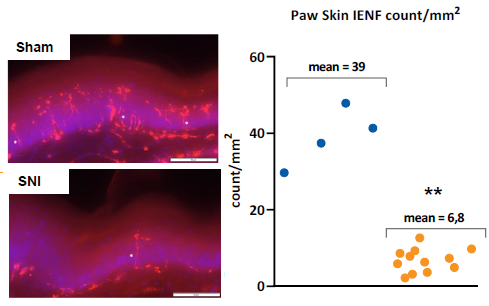
Figure 4. Mean IENF count in the ipsilateral paw skin 7 days after surgery. Left: representative images of PGP9.5-stained samples from skin. Right: Quantification of IENF endings (counts/mm2). Significances: ** p < 0.01 vs Sham. n (Sham males) = 3, n (Sham females) = 3, n (SNI males) = 3, n (SNI females) = 10. Image Credit: Charles River Laboratories.
Persistent tactile and cool allodynia two weeks after SNI surgery
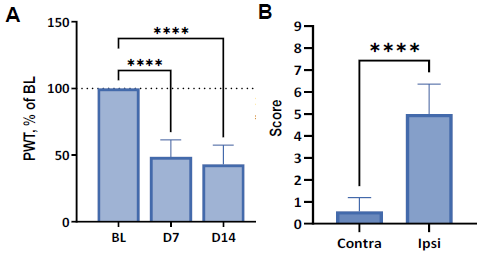
Figure 5. Tactile and cool allodynia induced by SNI at two weeks post-surgery. A: Tactile sensitivity normalized to BL sensitivity at BL one week and two weeks after SNI surgery. Data shown as mean [% of BL PWT] + SD; **** p < 0.0001 vs. BL (2-way ANOVA, Dunnett’s post hoc). B: Cool sensitivity as mean acetone test score at two weeks post-SNI. **** p < 0.0001 vs. contralateral paw score (Mann-Whitney test). Image Credit: Charles River Laboratories.
Functional ultrasound imaging of the somatosensory cortex
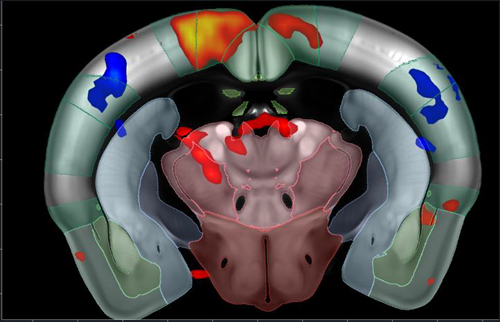
Figure 6. Functional ultrasound (fUS) imaging outline. fUS GLM map of brain response to pinprick. Image Credit: Charles River Laboratories.
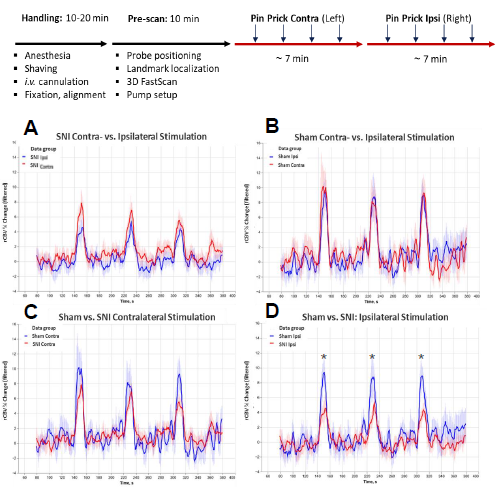
Figure 7. Relative cerebral blood volume (rCBV) signal time series (% rCBV change) detected with functional ultrasound (fUS). Pinprick stimulation was applied to the plantar paw according to the timeline shown in Figure 6. A, B: Contra- vs. ipsilateral % rCBV change is shown for (A) SNI and (B) sham animals. C, D: The (C) contralateral and (D) ipsilateral %rCBV change shown for sham vs. SNI mice. *-p<0.05 (One way ANOVA). Image Credit: Charles River Laboratories.
Conclusions
The mouse SNI model revealed significant changes in the behavioral, biomarker, and imaging readouts used in this investigation.
Various readouts can be used to investigate the efficacy of novel therapies for pain management or modulation of pathological processes related to neuropathic pain. This can add translational value to preclinical models of neuropathic pain, which have historically demonstrated poor translation from preclinical to clinical efficacy.
About Charles River Laboratories
At Charles River, we are passionate about our role in improving the quality of people’s lives. Our mission, our excellent science and our strong sense of purpose guides us in all that we do, and we approach each day with the knowledge that our work helps to improve the health and well-being of many across the globe.
Charles River provides essential products and services to help pharmaceutical and biotechnology companies, government agencies and leading academic institutions around the globe accelerate their research and drug development efforts.
As a fully integrated partner, Charles River can support your research at any point along the drug discovery continuum.
Sponsored Content Policy: News-Medical.net publishes articles and related content that may be derived from sources where we have existing commercial relationships, provided such content adds value to the core editorial ethos of News-Medical.Net which is to educate and inform site visitors interested in medical research, science, medical devices and treatments.