Sample preparation is essential when employing chromatography for bioanalytical analysis as system performance will be negatively affected if it is not performed. Preparation methods include protein precipitation, liquid-liquid extraction (LLE), phospholipid removal (PLR), and solid phase extraction (SPE).
Common issues can include blockages in the High-Performance Liquid Chromatography (HPLC) tubing, dirtying of the mass spectrometer source, column fouling, and reduced sensitivity.
The clean-up performance of different sample preparation methods varies.
Protein precipitation is among the most popular methods of prepararing biological samples, such as plasma and serum, for chromatographic analysis because it is simple and fast. Samples are added followed by solvent, causing the protein to crash out. The liquid is then drawn through a filter, leaving the sample protein-free.
While protein precipitation removes protein, it does not remove other matrix components, such as phospholipids. These can cause numerous problems when performing LC-MS/MS analysis.
Firstly, phospholipids are known to impact ionization within the mass spectrometer source. Ionization will cause ion enhancement or, more frequently, ion suppression, reducing the robustness of analysis.1
Phospholipids also contaminate the mass spectrometer source, leading to increased maintenance costs and downtime of instruments.
Finally, phospholipids can build up on an HPLC column, leading to higher backpressures over time and reducing column life.2
Phospholipid removal (PLR) is another sample preparation technique employed to prepare biological samples for analysis.
PLR follows the same procedure as a protein precipitation plate; however, an active component is combined with the product to capture phospholipids without retaining analytes of interest, as shown in Figure 1.
As a result, PLR provides a more complete solution for preparing biological samples.
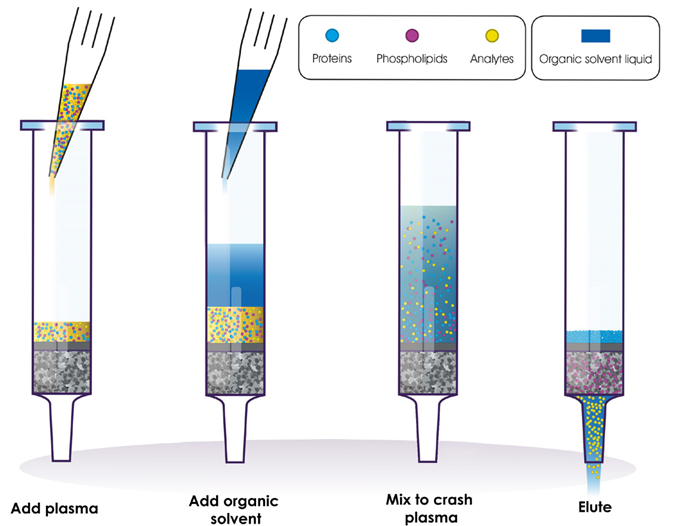
Figure 1. The simple PLR protocol for preparing plasma for LC-MS analysis. Image Credit: Porvair Sciences Limited
This article covers a study comparing the effectiveness of PLR and protein precipitation. Both techniques are assessed for phospholipid removal and recovery of analytes using bovine plasma for LC-MS/MS analysis. The Microlute® PLR plate was employed to prepare PLR samples.
The Microlute® range utilizes a unique composite technology outlined in Figure 2. This technology combines the active material to capture phospholipids with an inert polyethylene structure. This improves the reproducibility of sample preparation due to enhanced consistency of sample flow through to a collection plate.
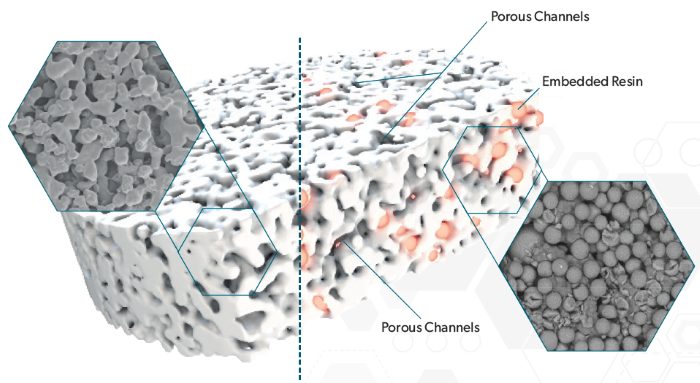
Figure 2. Diagrammatic representation of the Microlute® composite technology. Image Credit: Porvair Sciences Limited
Experimental
Spiked plasma preparation
Bovine plasma was spiked with procainamide at three concentrations (25, 250, and 1250 ng/mL), and solutions were mixed and left to equilibrate for one hour.
Calibration curve standards
Blank unspiked plasma (100 µL) was added to four wells of a Microlute® PLR plate, followed by acetonitrile (300 µL) with 1% formic acid (v/v). A pipette aspirated each well five times, ensuring the solution was adequately mixed and the protein fully crashed.
The crashed solution was eluted into a 1.1 mL collection plate using positive pressure at a flow rate of approximately 1 drop per second.
The processed crashed plasma was pooled into a 1.5 mL microcentrifuge tube and vortexed for 10 seconds. The combined processed plasma (100 µL) was added to six wells, making up one blank and five calibration standards.
The five calibration standards were spiked to concentrations of 10, 100, 200, 500, and 1500 ng/mL.
Processing spiked plasma
In duplicate, plasma at each spiked concentration (100 µL) was added to Microlute® PLR plate wells and a Protein Precipitation Plate. To each of these wells, acetonitrile with 1% formic acid (v/v) was added (300 µL).
A pipette aspirated the liquid in each well five times, ensuring the solution was adequately mixed and the protein fully crashed. The crashed solutions were eluted into a 1.1 mL collection plate using positive pressure at a flow rate of approximately one drop per second.
Dilution step
To improve the peak shape and robustness of the LC-MS/MS method, the processed spiked plasma and standard solutions were diluted 1:10 with water containing 0.1% formic acid (v/v). This prevented poor peak shape caused by the eluent's high organic strength.
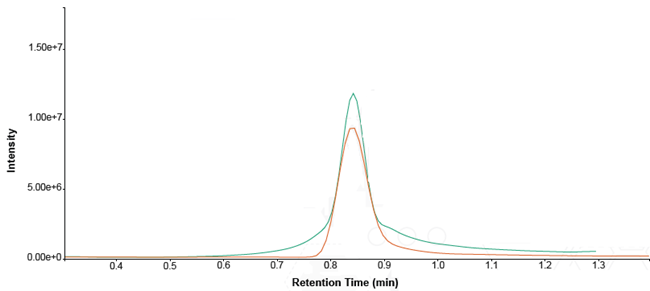
Figure 3. Overlaid comparison of procainamide peak shape – undiluted (green trace) versus 1:10 diluted (orange trace). Image Credit: Porvair Sciences Limited
LC-MS/MS method for post-column infusion
The method outlined below was employed to screen for common phospholipids present in the protein-precipitated and Microlute® PLR samples. It also monitored matrix effects (ion enhancement and suppression) via post-column infusion.3 The infused solution was 100 ng/mL of procainamide in mobile phase A (H2O + 0.1% formic acid), infused at 10 µL/min.
HPLC conditions
Source: Porvair Sciences Limited
| |
|
| System: ACQUITY Premier BSM/FTN |
Column: Thermo Fisher Hypersil GOLD™ C18
(2.1 mm x 50 mm, 1.9 μm) |
| Solvent A1 H2O + 0.1% formic acid |
Injection Volume 2 μL |
| Solvent B1 MeOH + 0.1% formic acid |
Column Temperature 40 °C |
| Gradient |
Sample Temperature 10 °C |
| Time |
A1 |
B1 |
| 0.00 |
20 |
80 |
| 0.50 |
20 |
80 |
| 1.00 |
0 |
100 |
| 3.00 |
0 |
100 |
| 3.01 |
20 |
80 |
| 4.00 |
20 |
80 |
|
Flow rate 400 μL/min |
| |
| |
| |
| |
| |
Mass spectrometer conditions
Source: Porvair Sciences Limited
| |
|
| System: |
Xevo TQ-S micro |
| Ionisation mode: |
Positive ESI |
| MRM transitions: |
See table below |
| Capillary voltage: |
2.5 kV |
| Source temperature: |
150 °C |
| Desolvation temperature: |
550 °C |
| Procainamide post-column infusion rate: |
10 μL/min |
| Infusions concentration: |
100 ng/mL |
MRM transitions
Source: Porvair Sciences Limited
| Analyte name |
Precursor (m/z) |
Product (m/z) |
Core voltage (V) |
Collision energy (V) |
| Procainamide |
235.92 |
163 |
23 |
15 |
| 18:0 LPC |
524.3 |
148.1 |
80 |
90 |
| 34.2 PC |
758.6 |
184.1 |
80 |
90 |
| 38.4 PC |
810.7 |
184.1 |
80 |
90 |
| 36.2 PC |
786.5 |
184.1 |
80 |
90 |
| 34.1 SM |
703.5 |
184.1 |
80 |
90 |
| 16:0 LPC |
496.3 |
184.1 |
80 |
90 |
LPC = Lysophophatidylcholines, PC = Phosphatidylcholine, SM = Sphingomyelin
LC-MS/MS method for procainamide
The LC-MS/MS method outlined in the table below was employed to analyze the spiked samples and calibration curve.
Source: Porvair Sciences Limited
| |
|
| System: ACQUITY Premier BSM/FTN |
Column: Restek Biphenyl (2.1 mm x 30 mm, 1.8 μm) |
| Solvent A1 H2O + 0.1% formic acid |
Injection Volume 2 μL |
| Solvent B1 MeOH + 0.1% formic acid |
Column Temperature 45 °C |
| Gradient |
Sample Temperature 10 °C |
| Time |
A1 |
B1 |
| 0.00 |
90 |
10 |
| 1.20 |
90 |
10 |
| 1.21 |
0 |
100 |
| 5.00 |
0 |
100 |
| 5.01 |
90 |
10 |
| 10.00 |
90 |
10 |
|
Flow rate 400 μL/min |
| |
| |
| |
| |
| |
Mass spectrometer conditions
Source: Porvair Sciences Limited
| |
|
| System: |
Xevo TQ-S micro |
| Ionisation Mode: |
Positive ESI |
| MRM Transitions: |
Procainamide 235.92 -> 163 |
| Capillary Voltage: |
0.5 kV |
| Source Temperature: |
150 °C |
| Desolvation Temperature: |
550 °C |
| Desolvation Gas Flow: |
1000 L/h |
| Cone Voltage: |
23 V |
| Collision Energy: |
15 V |
Results and discussion
Phospholipid removal
To analyze the presence of remaining phospholipids in a plasma sample prepared by protein precipitation and composite PLR technology, an MRM LC-MS/MS method was employed to detect common phospholipids in plasma.
Very little phospholipid signal was detected for the phospholipid removal plate, with the chromatogram primarily displaying baseline noise. This confirmed that all phospholipids interfering with analysis had been removed from the sample, as shown in Figure 4.
In contrast, the protein-precipitated sample displayed large peak areas, indicating that phospholipids remained in the sample.
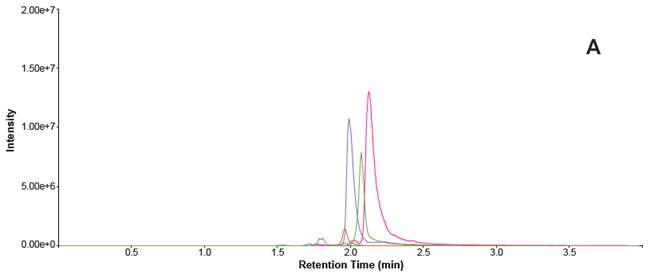
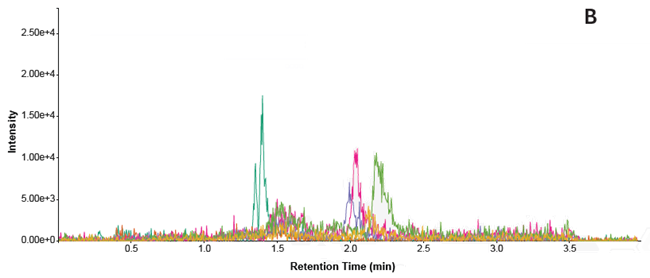
Figure 4. Overlaid traces of phospholipid MRMs in each sample. A = protein precipitated sample B = phospholipid removal plate. Image Credit: Porvair Sciences Limited
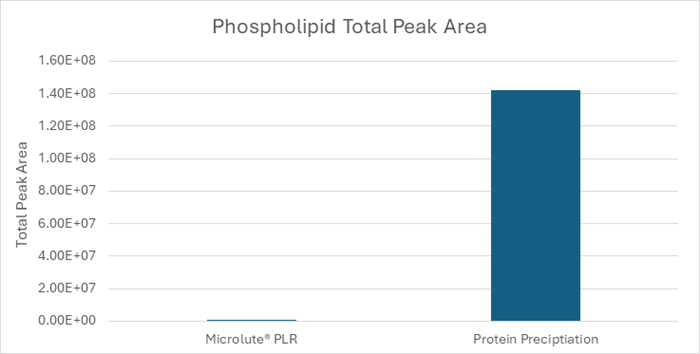
Figure 5. Comparison of total phospholipid peak areas in samples prepared using a Microlute® PLR plate and a protein precipitation plate. Total peak area for Microlute® PLR = 5.47 x 10⁴ and protein precipitation = 1.42 x 10⁸. Image Credit: Porvair Sciences Limited
The total peak areas were compared from the phospholipid traces, shown in Figure 4, and are presented in Figure 5. The observed response was minimal for the phospholipids in the Microlute® PLR sample (5.47 x 10⁴), whereas the protein precipitation sample displayed a very large total peak area (1.42 x 10⁸).
Matrix effects – Ion suppression
To quantify the effect of the phospholipids on ionization, a post-column infusion of procainamide was performed while injecting a blank sample prepared using both the protein precipitation and Microlute® PLR plates.
The phospholipid removal plate (blue trace) showed that ionization was unaffected throughout the run compared with a blank solution infusion (green trace).
On the other hand, the protein-precipitated solution (black trace) displayed a baseline dip between 1.5 minutes and 2.5 minutes due to phospholipid ion suppression.
These traces are displayed in Figure 6, where a large reduction in signal can be seen where the phospholipids co-elute (red trace). The largest reduction in signal observed was a ∼75% reduction in procainamide signal at a retention time of ∼2 minutes.
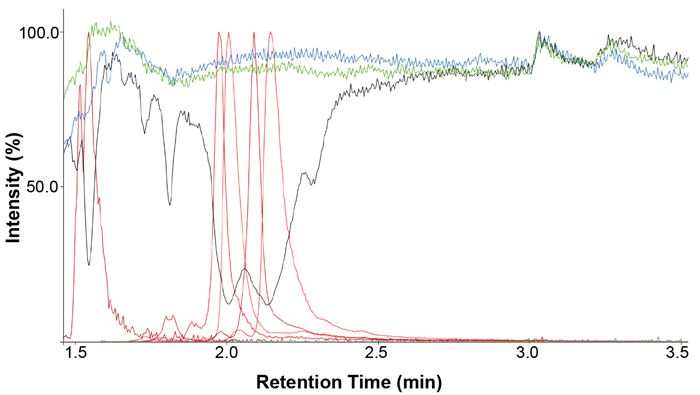
Figure 6. An overlay of the infusion traces of procainamide with an injection of a solvent blank (green), Microlute® PLR prepared sample (blue) and protein precipitated samples (black). The phospholipid trace for the protein precipitated sample is also overlaid (red). Image Credit: Porvair Sciences Limited
Procainamide calibration curve
Matrix-matched standards were prepared to demonstrate the creation of a calibration curve with the Microlute® PLR, as shown in Figure 7. The calibration curve was linear and had a correlation coefficient (r2) of 0.9995. The work presented here displayed a linear calibration range for procainamide from 10 ng/mL to 1500 ng/mL.
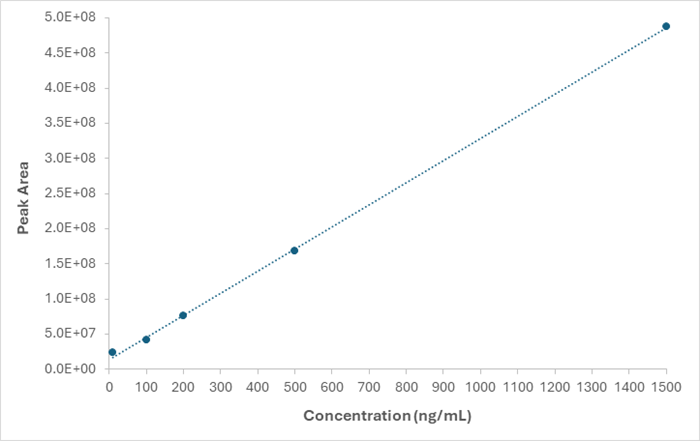
Figure 7. A matrix-matched standard calibration curve ranging from 10 – 1500 ng/mL r2 value = 0.9995. Image Credit: Porvair Sciences Limited
Comparison of preparation of procainamide – Protein precipitation versus PLR
To simulate quality control (QC) samples used in bioanalytical methods, plasma was prepared in duplicate at three concentrations – low QC (25 µg/mL), medium QC (250 µg/mL) and high QC (1,250 µg/mL). All concentrations were prepared by protein precipitation and a Microlute® PLR plate.
LC-MS/MS was used to analyze these samples, and the peak areas were compared to generate a percentage difference. The lowest and most challenging concentration displayed a difference of 9.6%, as shown in Table 1.
This demonstrated that both preparation methods were equally effective at recovering procainamide from the plasma.
Table 1. Peak areas for procainamide in plasma prepared at the three concentrations levels in duplicate. The percentage difference between the two techniques' peak areas at each concentration. Source: Porvair Sciences Limited
| Technique |
Concentration (ng/mL) |
| 25 |
250 |
1250 |
| R1 |
R2 |
Mean |
R1 |
R2 |
Mean |
R1 |
R2 |
Mean |
| Protein Precipitation |
1.0E+07 |
1.1E+07 |
1.0E+07 |
8.2E+07 |
8.5E+07 |
8.4E+07 |
3.8E+08 |
4.0E+08 |
3.9E+08 |
| Phospholipid Removal |
9.7E+06 |
9.4E+06 |
9.5E+06 |
7.9E+07 |
7.8E+07 |
7.9E+07 |
3.7E+08 |
3.7E+08 |
3.7E+08 |
| Percentage Difference |
9.6 |
5.9 |
4.5 |
Conclusions
The study discussed here demonstrated the importance of sample preparation before chromatographic analysis of biological samples. This practice prevents ion suppression, which can result in lower signal and reduced sensitivity, and reduce the need for instrument maintenance.
Recovery was also unaffected by the active component removing phospholipids when comparing preparation techniques. A comparison of protein precipitation and PLR demonstrated that the Microlute® PLR plate delivered superior performance, maintaining recovery and reducing ion suppression, resulting in more reliable and robust analytical results.
Acknowledgments
Produced from materials originally authored by James Edwards from Porvair Sciences.
References and further reading
- Ismaiel, O.A., et al. (2008). Monitoring phospholipids for assessment of ion enhancement and ion suppression in ESI and APCI LC/MS/MS for chlorpheniramine in human plasma and the importance of multiple source matrix effect evaluations. Journal of Chromatography B, 875(2), pp.333–343. https://doi.org/10.1016/j.jchromb.2008.08.032.
- Carmical, J. and Brown, S. (2016). The impact of phospholipids and phospholipid removal on bioanalytical method performance. Biomedical Chromatography, 30(5), pp.710–720. doi:https://doi.org/10.1002/bmc.3686.
- Phillips, G.B. and Dodge, J.T. (1967). Composition of phospholipids and of phospholipid fatty acids of human plasma. Journal of Lipid Research, [online] 8(6), pp.676–681. Available at: https://pubmed.ncbi.nlm.nih.gov/6057496/.
About Porvair Sciences Limited
Porvair Sciences are global leaders in the manufacturing and development of cutting-edge porous plastic materials and microplate technologies for the biotechnology and life science industries. From microplates and assay kits to automated laboratory equipment, our company is committed to the creation of workflow solutions with high quality products for improved analysis. Offering customers a diverse portfolio dedicated to high quality sample preparation, our innovative products are designed to increase productivity and accelerate scientific discovery with integrity.
Microlute®
The Microlute® range of sample preparation products were designed with reproducibility in mind. At the heart of the range are products with a unique hybrid structure, comprising a porous plastic disc with embedded active materials to enhance sample cleanup and analyte recovery. Discover the range of sample preparation solutions including solid phase extraction (SPE), phospholipid removal (PLR) and supported liquid extraction (SLE).
Sponsored Content Policy: News-Medical.net publishes articles and related content that may be derived from sources where we have existing commercial relationships, provided such content adds value to the core editorial ethos of News-Medical.Net which is to educate and inform site visitors interested in medical research, science, medical devices and treatments.