Evaporation is an endothermic process undertaken by all liquids. This physical state change occurs when surface molecules gain sufficient kinetic energy to overcome the enthalpy of vaporization. Such a change is entropically favorable, allowing evaporation to occur below the liquid's boiling point.
In a laboratory environment, evaporation is employed to separate, concentrate and purify compounds.1 Techniques, including distillation and rotary evaporation, depend solely on the evaporation of solvents and their respective properties.2
Sample preparation for chromatography employs solvent evaporation extensively. The common sample preparation technique, Solid Phase Extraction (SPE), often incorporates an evaporation step for the final eluent, providing several benefits for analysis.3,4
For instance, following evaporation, samples can be reconstituted in a lower volume of solvent, increasing the method's sensitivity. Solvent composition can also be modified to enhance peak shapes in chromatographic methods. In addition, volatile interferences may be evaporated, improving a sample's cleanliness.
These advantages result in a cleaner, more concentrated sample with fewer interfering compounds, improving selectivity and sensitivity.
Evaporation has many requirements, meaning some traditional techniques are not flexible enough to meet the demands. Evaporation in a lab environment requires working with various types of well plates (24, 48, 96, and 384 wells). In addition, compounds with heat or air sensitivity can be a challenge, and sample cleanliness is also important.
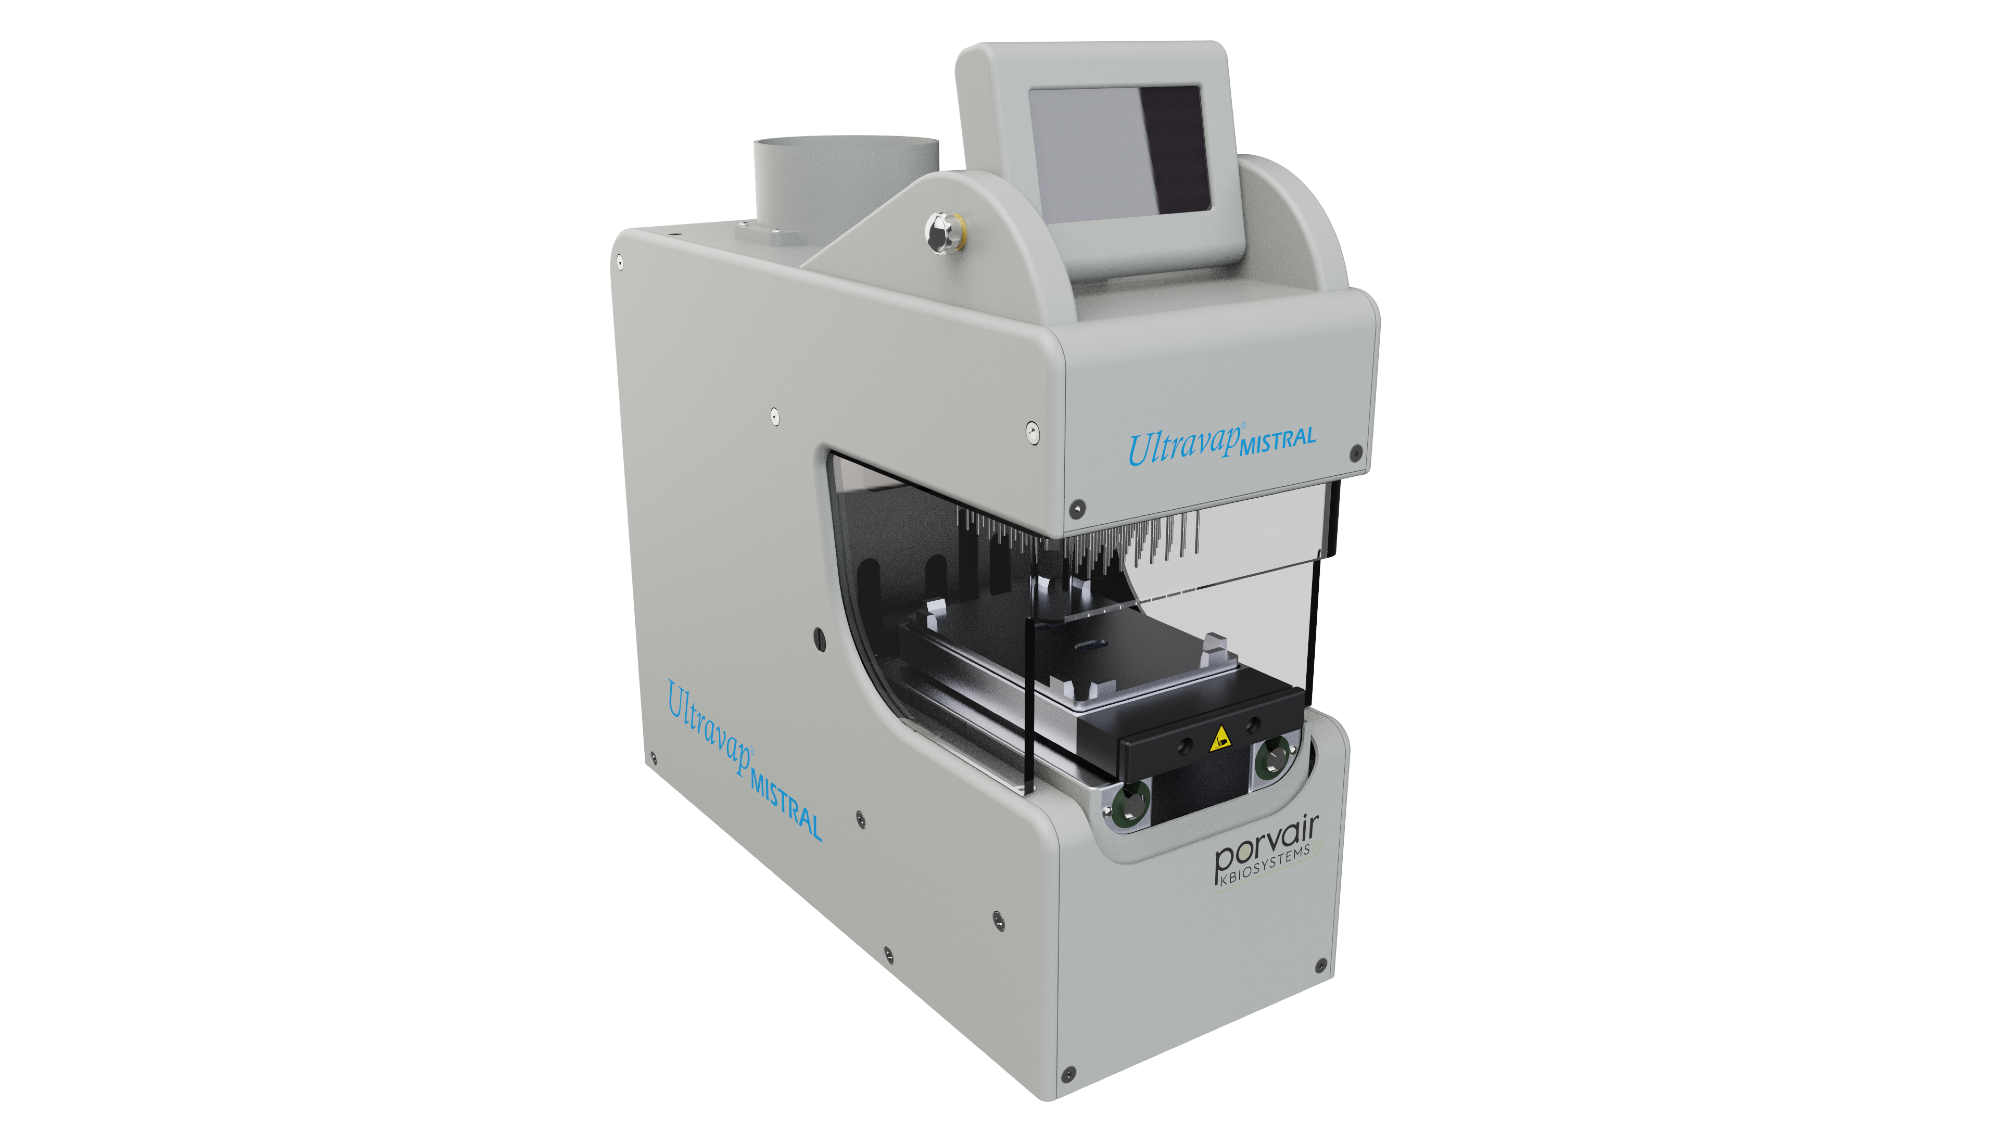
Image Credit: Porvair Sciences Limited
In the study discussed in this article, the Ultravap® Mistral blowdown evaporator is employed. This equipment directs heated gas, usually nitrogen, through a needle head onto the sample surface to gently evaporate the solvent. This method results in lower thermal degradation of samples as only the surface is heated, leaving most of the sample at ambient temperature.
The evaporator has several controllable parameters, including gas temperature, gas flow rate, and needle position. All are adjustable over time to fit the desired evaporation application.
The Ultravap® Mistral employs heated gas to displace the solvent surface, providing a large surface area for evaporation. Knudsen-Langmuir’s equations demonstrate that surface area is directly proportional to the rate of evaporation, as shown in Equation 15. As a result, providing maximum surface area is vital for efficient evaporation.
The needle height of the Ultravap® Mistral can be modified to remain a set distance from the surface during solvent evaporation. By tracking the height of the liquid surface during evaporation, maximum displacement can be achieved throughout the evaporation run
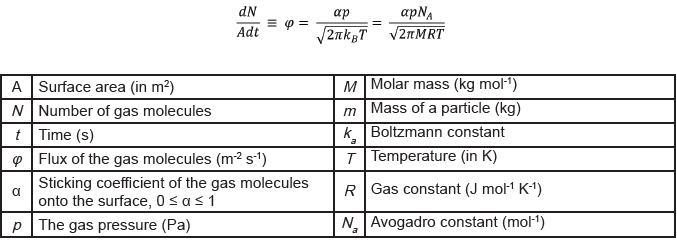
Equation 1. Knudsen-Langmuir’s equation describing the rate of evaporation of molecules from a surface based on kinetic theory
Sufficient kinetic energy is provided by blowdown evaporation to allow the upper surface molecules to overcome the enthalpy of vaporization. As a result, evaporation occurs at a considerably lower temperature than the boiling point of the bulk solvent, allowing gas temperature to be set lower. In contrast, bulk evaporation techniques provide heat to the entire volume of solvent being evaporated.
Rate of evaporation is strongly dependent on vapor pressure, enthalpy of vaporization and solvent viscosity, rather than the boiling point. For example, hexane (which has a relatively high boiling point of 69 °C) readily evaporates at room temperature due to a very small enthalpy of vaporization (31.5 kJ/mol @ 25 °C) and high vapor pressure (20.1 kPa @ 25 °C).6-8
Predicting the effect of gas temperature and flow on evaporation rate can be challenging. The study discussed here assesses the effect of various conditions on the evaporation rate of several solvents.
The evaporation rate is quantitatively assessed and compared by testing a range of temperatures (30, 60, and 80 °C) and gas flow rates (55 and 75 L/min) to evaporate the solvents. This provides information on the efficiency and effectiveness of evaporation methods, with exact needle heights and optimal conditions for fast solvent evaporation.
Method
A non-intrusive gravimetric method was required to determine the rate of solvent evaporation.
Firstly, the mass of an empty 96-well square 2 mL polypropylene (PP) deep well collection plate and silicone cap mat was measured to 4 decimal places. The latter was used to remove unwanted evaporation during the weighing process, giving a more accurate measurement.
The Ultravap® Mistral was pre-heated to the required temperature before each experiment, minimizing temperature differences between tests. Solvent (1 mL) was added to the collection plate, and the total mass of the plate, seal, and solvent was measured before placing the plate in the Ultravap® Mistral.
The initial needle position was set to approximately 10 mm above the solvent surface, with a value between 27 mm and 28.5 mm programmed into the Ultravap® Mistral's method, depending on the solvent's expansion properties.
The initial temperature of the solvent was assumed to be ambient (23 °C). A fixed-height evaporation method was created for the Ultravap® Mistral, where the needle height remained constant during the evaporation run.
After 2-15 minutes (the solvents with a slower evaporating rate had a longer elapsed time between measurements), the process was stopped, the plate sealed and the remaining solvent mass determined. Next, the plate was returned to the evaporator, and if necessary, the needle height was modified to maintain a distance of approximately 10 mm from the surface.
This process was repeated until all the solvent had evaporated, and the procedure was repeated with different temperatures, gas flow rates, and solvents.
Following these experiments, the mass of the plate at each point in time was converted to an average volume of solvent per well using Equation 2. The gradient of a plot of these values against time returned a total average evaporation rate.

Equation 2. Shows how the average solvent volume per well was calculated (using the empty and solvent-filled plate mass (g)) along with the number of wells (96), divided by the solvent density in g/μL
Due to the shape of the collection plate wells, the evaporation rate was split into a top “cuboid” section (section 1) and a lower “cone” section (section 2), as shown in Figure 1.
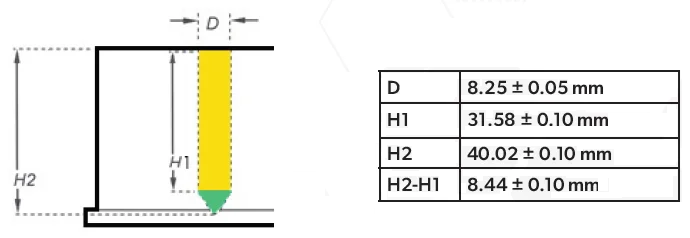
Figure 1. A schematic of the collection plate well includes dimensions used to calculate solvent height and needle heights. Yellow = Section 1 & Green = Section 2. Image Credit: Porvair Sciences Limited
The solvent volume was converted to solvent height within the collection plate, allowing the vertical height of the solvent surface to be tracked. The total internal volume of the 2 mL PP deep well collection plate was 2,300 µL. Section 1 comprised 2,150 µL and section 2 comprised 150 µL. In cases where the volume was greater than 150 µL, vertical height was determined with Equation 3.

Equation 3. Shows how the solvent height was calculated for solvent volumes of greater than 150 μL
Due to the inverted cone shape of the wells, calculating the height of the solvent surface for volumes under 150 µL required a different method. The cone's diameter varied with reducing volume; hence, a standard cone volume calculation was not suitable. However, as the cone was symmetrical, there was a constant height-to-radius ratio, leading to Equation 4 for the vertical height.
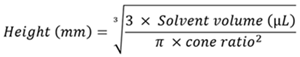
Equation 4. Shows how the solvent height was calculated for solvent volumes of less than 150 μL
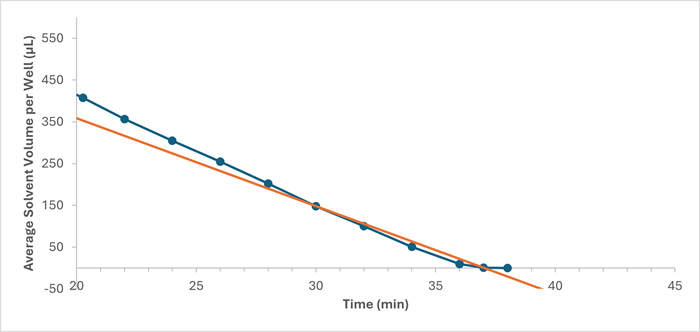
Figure 2. Evaporation rate plot of the average solvent volume per well (μL) against time (min) for 100% methanol at 80 °C and 55 L/min (focusing on the final 18 min of evaporation). The total time of evaporation was approximated using the data points corresponding to volumes less than 180 μL. The orange line shows how this data was interpolated. Image Credit: Porvair Sciences Limited
The total evaporation time was approximated for each solvent from the interpolated x-intercept on each evaporation rate plot. Figure 2 shows an example evaporation rate plot for 100 % methanol at 80 °C and 55 L/min.
Predicted evaporation times for given solutions were calculated and cross-checked for accuracy against experimental data. The predicted evaporation time for every water-organic solvent mixture was calculated by inputting the gradient and y-intercept from the evaporation rate plots and the respective mixture volumes into Equation 5.
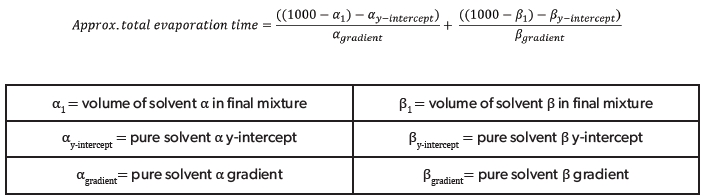
Equation 5. Shows how the approximate total evaporation times for the mixture of two pure solvents was calculated using the pure solvent evaporation rate plots
Several approximations and assumptions helped interpret the data.
- Solvent composition and density remained constant throughout the experiment
- No evaporation occurred during the weighing process
- Cumulative evaporation time, including pauses for weighing, was comparable to uninterrupted evaporation
- Plate and seal mass remained constant throughout the experiment
- All wells evaporated at the same rate
- Initial solvent temperature was the same for all experiments
Table 1 lists the solvents employed in this study.
Table 1. Chemical and physical properties of methanol, acetonitrile and water at 25 °C and 75 °C [9-28] *Data could not be sourced so an assumption was made that these values would decrease in line with the other solvents. Source: Porvair Sciences Limited
| Solvent |
Surface Tension
25 °C -75 °C (mN/m) |
Dynamic Viscosity
25 °C – 75 °C (cP) |
Enthalpy of Vaporization
25 °C – 75 °C
(kJ/mol) |
Vapour Pressure
25 °C – 75 °C (kPa) |
Boiling
Point (°C) |
| Methanol |
22.31 – 18.45 |
0.543 – 0.294 |
37.5 – 34.5 |
16.86 – 150.33 |
64.7 |
| Acetonitrile |
287 - <287* |
0.334 - <0.334* |
37.2 – 30.5 |
11.76 – 81.17 |
82 |
| Water |
71.99 – 63.58 |
0.890 – 0.377 |
44.0 – 41.8 |
3.12 – 38.53 |
100 |
Results and discussion
Temperature effect
Higher temperature yielded faster overall evaporation rate for every solvent at both gas flow rates (55 L/min and 75 L/min). Figure 3 and Table 2 display an example of this trend, using 55 L/min gas flow rate data.
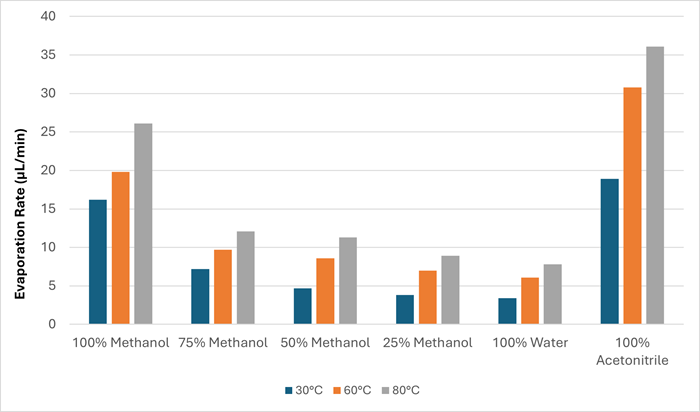
Figure 3. Chart showing the evaporation rate in μL/min at three gas temperatures (30, 60 and 80 °C) at a gas flow rate of 55 L/min. Image Credit: Porvair Sciences Limited
Table 2. Evaporation rate data for different solvents at three gas temperatures (30, 60 and 80 °C) at 55 L/min. Source: Porvair Sciences Limited
| Temperature (°C) |
Evaporation Rate (μL/min) |
100%
Methanol |
75%
Methanol |
50%
Methanol |
25%
Methanol |
100%
Water |
100%
Acetonitrile |
| 30 |
16.2 |
7.2 |
4.7 |
3.8 |
3.4 |
18.9 |
| 60 |
19.8 |
9.7 |
8.6 |
7 |
6.1 |
30.8 |
| 80 |
26.1 |
12.1 |
11.3 |
8.9 |
7.8 |
36.1 |
The percentage increase in evaporation rate at a gas flow rate of 55 L/min was generally much larger between 30 °C and 60 °C when compared with 60 °C to 80 °C, as shown in Figure 4 and Table 3.
This is the case even when the increase per °C is accounted for. This is likely because the larger increase from 30 °C to 60 °C introduces more kinetic energy to the molecules. In contrast, at 60 °C to 80 °C, the solvent molecules already possess significant kinetic energy, and as a result, the rate increase is not as high. The same trend was observed at a gas flow rate of 75 L/min.
However, this trend was not observed for methanol, likely due to the large increase in vapor pressure at 75 °C, compared to 25 °C, as shown in Table 1. The increase is much larger than the other solvents in this study and would explain the larger increase in evaporation rate at the higher temperature compared with other solvents. This was also observed at the higher flow rate of 75 L/min.
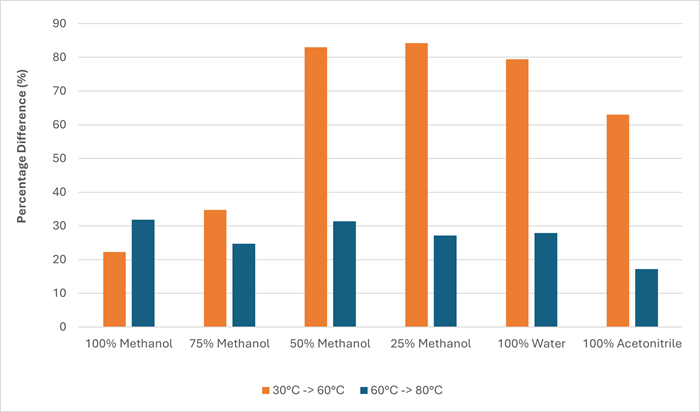
Figure 4. Chart showing the percentage difference in evaporation rate as a result of increasing the gas temperature from 30 °C to 60 °C and 60 °C to 80 °C at a gas flow rate of 55 L/min. Image Credit: Porvair Sciences Limited
Table 3. Percentage difference of evaporation rates at the two temperature increases (30 °C to 60 °C and 60 °C to 80 °C), with per °C values. Source: Porvair Sciences Limited
Gas Temperature
Setting |
Percentage Difference |
100%
Methanol |
75%
Methanol |
50%
Methanol |
25%
Methanol |
100%
Water |
100%
Acetonitrile |
| 30 °C to 60 °C |
22.2 |
34.7 |
83.0 |
84.2 |
49.4 |
63.0 |
| 60 °C to 80 °C |
31.8 |
24.7 |
31.4 |
27.1 |
27.9 |
17.2 |
| 30 °C to 60 °C (per °C) |
0.7 |
1.2 |
2.8 |
2.8 |
2.6 |
2.1 |
| 60 °C to 80 °C (per °C) |
1.6 |
1.2 |
1.6 |
1.4 |
1.4 |
0.9 |
Gas flow rate effect
Increased gas flow rate resulted in a faster overall evaporation rate at all temperatures studied (30, 60 and 80 °C). Figure 5 and Table 4 show an example of the data at 60 °C.
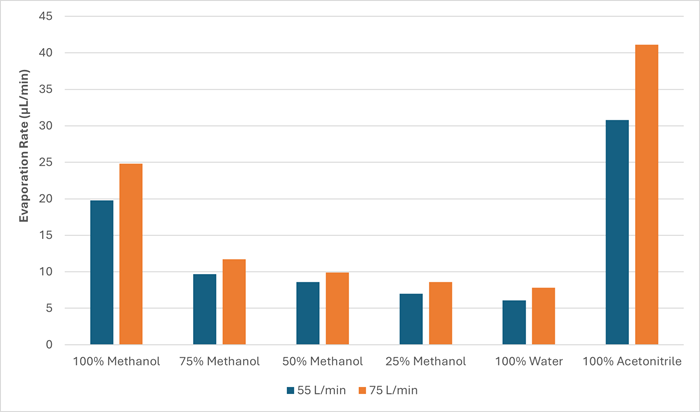
Figure 5. Chart showing the difference in evaporation rate at the two different gas flow rates (55 and 75 L/min) at 60 °C. Image Credit: Porvair Sciences Limited
Table 4. Evaporation rates at 60 °C of the two gas flow rates (55 and 75 L/min), percentage difference in the evaporation rates at the two flow rates and viscosity of the solutions. Source: Porvair Sciences Limited
| Flow Rate |
Evaporation Rate (μL/min) |
100%
Methanol |
75%
Methanol |
50%
Methanol |
25%
Methanol |
100%
Water |
100%
Acetonitrile |
| 55 L/min |
19.8 |
9.7 |
8.6 |
7 |
6.1 |
30.8 |
| 75 L/min |
24.8 |
11.7 |
9.9 |
8.6 |
7.8 |
41.1 |
Percentage
Difference |
25.3 |
20.6 |
15.1 |
22.9 |
27.9 |
33.4 |
Viscosity of the
solution (cP)[18] |
0.6 |
1.2 |
1.5 |
1.4 |
0.9 |
0.3 |
Mixtures containing 75, 50, and 25% methanol demonstrated that increasing the gas flow rate from 55 L/min to 75 L/min impacted the evaporation rate less than pure methanol at all temperatures. This is likely due to the solution's viscosity, as a higher viscosity resulted in less impact on the flow rate.
The higher the viscosity, the higher the force required to displace the surface of the liquid. Therefore, an increased flow rate results in less displacement and surface area for evaporation, reducing the evaporation rate.
Methanol vs Acetonitrile
This study revealed that water interacts differently with methanol and acetonitrile during evaporation.
Two linear evaporation sections (between 0 and ~16 minutes and from ~16 minutes to ~78 minutes) are observed for acetonitrile, as shown in Figure 6. This suggests that the acetonitrile evaporated first, followed by water due to its slower rate, reducing the overall evaporation rate.
In contrast, a curve can be seen for methanol-water mixtures. This may be due to water hydrogen bonding to methanol, forming clusters and larger hydrogen-bonded species.29 Such bonding would increase the energy needed to break the hydrogen bonds to allow solvent to evaporate.
On the other hand, acetonitrile-water solutions form stronger but fewer hydrogen bonds, resulting in weaker cluster formation.30
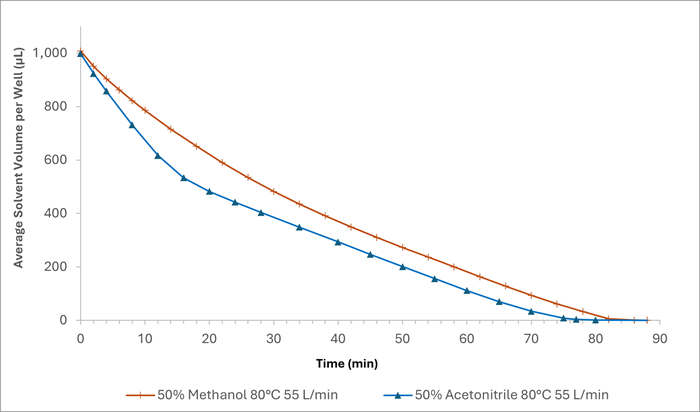
Figure 6. A plot to compare the volume of solvent remaining in the plate over time following evaporation at 80 °C and 55 L/min. The orange trace = 50% methanol and blue trace = 50% acetonitrile. Image Credit: Porvair Sciences Limited
Mixtures of solvents
Evaporation times for mixtures of solvents were hypothesized to be predictable by extrapolating the pure solvent evaporation rates via Equation 5.
In the case of an acetonitrile-water solution, Equation 5 gives a reasonable estimate with only a 6.3% difference in time between the predicted and experimental values, as shown in Figure 7A.
However, it took longer for methanol-water mixtures to evaporate compared with the predicted evaporation time, with a percentage difference of 28% between the predicted and experimental values, as shown in Figure 7B.
Therefore, prediction is not simple due to the different interactions between the two solvents outlined above. Increased viscosity combined with hydrogen bonding results in a slower-than-expected evaporation time. In addition, the same variance was observed for acetonitrile between the predicted and recorded values at all concentrations. However, the evaporation rate for methanol varied from the predicted value more with increasing percentage of methanol in the solution (Table 5).
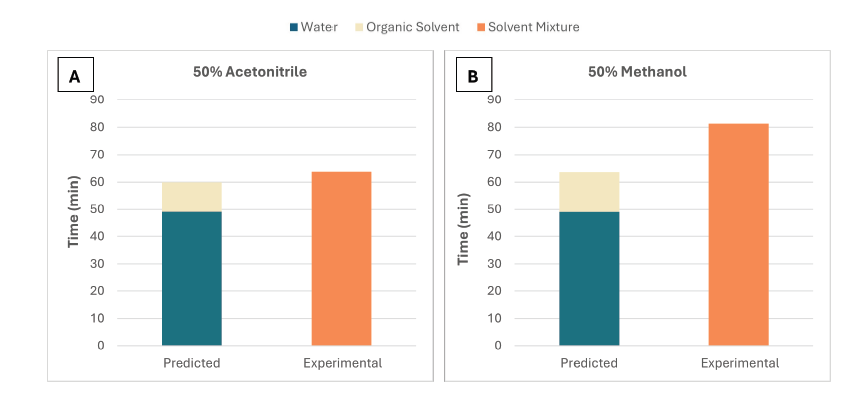
Figure 7. Predicted evaporation times (calculated using equation 5 for 50% acetonitrile and 50% methanol versus the experimental time measured in this study. The experimental data was performed at 80 °C and 75 L/min. Image Credit: Porvair Sciences Limited
Table 5. Percentage difference between the predicted and experimental evaporation time values for different mixtures of acetonitrile and methanol in water. The experimental data was performed at 80 °C and 75 L/min. Source: Porvair Sciences Limited
| Organic Solvent Percentage (%) |
Percentage Difference (Predicted vs Experimental Evaporation Time) |
| Acetonitrile |
Methanol |
| 25 |
5.3 |
20.5 |
| 50 |
6.3 |
28.0 |
| 75 |
5.2 |
32.7 |
Conclusions
In the study outlined here, evaporation rates of common chromatography solvents using the Ultravap® Mistral blowdown evaporator were calculated at various temperatures and gas flow rates.
Temperature significantly increased the evaporation rate. Higher gas flow rates also contributed, albeit to a lesser extent.
The study revealed differences in the evaporation dynamics of solvent mixtures, acetonitrile-water, and methanol-water, likely due to interactions between methanol and water.
The data collected can be used to optimize evaporation methods, such as temperature and flow rate conditions on the Ultravap® Mistral and needle height settings, as well as improve solvent evaporation time predictions for different solvent and solvent-water mixtures.
Acknowledgments
Produced from materials originally authored by Patrick Wale and James Edwards from Porvair Sciences.
References and further reading
- Chantel, D. J., Tester, C. (2013). Chapter Twelve - Precipitation in Liposomes as a Model for Intracellular Biomineralization. Methods in Enzymology. 532, pp.257-276.
- Lord, E. P. H.L. (2012). Sample Preparation Automation for GC Injection. Comprehensive Sampling and Sample Preparation, pp.597-612.
- Edwards, J. Is poor sample prep impacting your bioanalytical methods?, Porvair Sciences Limited. https://www.microplates.com/app/uploads/2024/10/Composite-Comparison.pdf.
- Porvair Sciences. (2025). Resources Archive - Porvair Sciences. (online) Available at: https://www.microplates.com/resources/ (Accessed 31 Jan. 2025).
- Kolasinski, K.W. (2012). Surface science. https://download.e-bookshelf.de/download/0000/6449/73/L-G-0000644973-0002366200.pdf.
- Haynes, W. (2010-2011). CRC Handbook of Chemistry and Physics, 91st, pp.3-282.
- Majer, V., Svoboda, V., Kehiaian, H.V. and International Union of Pure and Applied Chemistry (1985). Enthalpies of vaporization of organic compounds: a critical review and data compilation. (online) Library Catalog (Blacklight). Oxford [Oxfordshire] ; Boston: Blackwell Scientific Publications. Available at: https://searchworks.stanford.edu/view/1278927.
- Willingham, C.B., et al. (1945). Vapor pressures and boiling points of some paraffin, alkylcyclopentane, alkylcyclohexane, and alkylbenzene hydrocarbons. Journal of Research of the National Bureau of Standards, (online) 35(3), p.219. https://doi.org/10.6028/jres.035.009.
- Anton Paar. (2025). Viscosity of Acetonitrile – viscosity table and viscosity chart | Anton Paar Wiki. (online) Available at: https://wiki.anton-paar.com/kr-en/acetonitrile/ (Accessed 31 Jan. 2025).
- Anton Paar. (2024). Viscosity of Methanol – viscosity table and viscosity chart | Anton Paar Wiki. (online) Available at: https://wiki.anton-paar.com/kr-en/methanol/.
- Anton Paar. (2025). Viscosity of Water – viscosity table and viscosity chart | Anton Paar Wiki. (online) Available at: https://wiki.anton-paar.com/kr-en/water/ (Accessed 31 Jan. 2025).
- Bridgeman, O.C. and Aldrich, E.W. (1964). Vapor Pressure Tables for Water. Journal of Heat Transfer, 86(2), pp.279–286. https://doi.org/10.1115/1.3687121.
- CRC. (1962). Handbook of Chemistry and Physics, 44th, CRC Press.
- C. E. R. I. Center. (2007). Pure Component Properties. [Online] Available at: https://en.wikipedia.org/wiki/Acetonitrile (Accessed on 15 October 2024).
- Ambrose, D., et al. (1975). Thermodynamic properties of organic oxygen compounds XXXVIII. Vapour pressures of some aliphatic ketones. The Journal of Chemical Thermodynamics, 7(5), pp.453–472. https://doi.org/10.1016/0021-9614(75)90275-x.
- Dojcansky, J. and Heinrich, J. (n.d.). Saturated vapour pressure of acetonitrile. (online) Available at: https://www.chemicalpapers.com/file_access.php?file=282a157.pdf.
- Ge, X. and Wang, X. (2009). Estimation of Freezing Point Depression, Boiling Point Elevation, and Vaporization Enthalpies of Electrolyte Solutions. Industrial & Engineering Chemistry Research, 48(4), pp.2229–2235. https://doi.org/10.1021/ie801348c.
- Thompson, J.W., Kaiser, T.J. and Jorgenson, J.W. (2006). Viscosity measurements of methanol–water and acetonitrile–water mixtures at pressures up to 3500bar using a novel capillary time-of-flight viscometer. Journal of Chromatography A, 1134(1-2), pp.201–209. https://doi.org/10.1016/j.chroma.2006.09.006.
- Editor Engineeringtoolbox (2025). Surface tension. Available at: https://www.engineeringtoolbox.com/surface-tension-d_962.html.
- Urban, J. (2010). Mobile phase viscosity – Chromatographer. Available at: http://www.chromatographer.com/mobile-phase-viscosity/.
- Ewing, M.B. and Sanchez, J.C. (2004). Vapor Pressures of Acetonitrile Determined by Comparative Ebulliometry. Journal of Chemical & Engineering Data, 49(3), pp.486–491. https://doi.org/10.1021/je034144f.
- Hu, H., Weinberger, C.R. and Sun, Y. (2014). Effect of Nanostructures on the Meniscus Shape and Disjoining Pressure of Ultrathin Liquid Film. Nano Letters, 14(12), pp.7131–7137. https://doi.org/10.1021/nl5037066.
- NIST. Informatics, N.O. of D.A. Acetonitrile. Available at: https://webbook.nist.gov/cgi/cbook.cgi?ID=C75058&Mask=4.
- NIST. Informatics, N.O. of D.A. Methyl alcohol. Available at: https://webbook.nist.gov/cgi/cbook.cgi?ID=C67561&Units=SI&Mask=4#Thermo-Phase.
- NIST. Informatics, N.O. of D.A. Water. Available at: https://webbook.nist.gov/cgi/cbook.cgi?ID=C7732185&Mask=4.
- Pal, J., Patla, A. and Subramanian, R. (2021). Thermodynamic properties of forming methanol-water and ethanol-water clusters at various temperatures and pressures and implications for atmospheric chemistry: A DFT study. Chemosphere, (online) 272, p.129846. https://doi.org/10.1016/j.chemosphere.2021.129846.
- Grinberg, N. and Grushka, E. (2017). Advances in Chromatography. CRC Press. Available at: https://www.routledge.com/Advances-in-Chromatography-Volume-54/Grinberg-Grushka/p/book/9781032402130?srsltid=AfmBOooLPkDf4FJxsmFTOHfRyslXFvPCW29tJLiPjx2Pj1Mco7A2QIWA.
- Vazquez, G., Alvarez, E. and Navaza, J.M. (1995). Surface Tension of Alcohol Water + Water from 20 to 50 .degree.C. Journal of Chemical & Engineering Data, 40(3), pp.611–614. https://doi.org/10.1021/je00019a016.
- DataPhysics Instruments GmbH. Surface tension values of some common test liquids for surface energy analysis. (n.d.). Available at: https://cdn.dataphysics-instruments.com/Downloads/Surface-Tensions-Energies.pdf?v=1.0.
- Stull, D.R. (1947). Vapor Pressure of Pure Substances. Organic and Inorganic Compounds. Industrial & Engineering Chemistry, 39(4), pp.517–540. https://doi.org/10.1021/ie50448a022.
About Porvair Sciences Limited
Porvair Sciences are global leaders in the manufacturing and development of cutting-edge porous plastic materials and microplate technologies for the biotechnology and life science industries. From microplates and assay kits to automated laboratory equipment, our company is committed to the creation of workflow solutions with high quality products for improved analysis. Offering customers a diverse portfolio dedicated to high quality sample preparation, our innovative products are designed to increase productivity and accelerate scientific discovery with integrity.
Microlute®
The Microlute® range of sample preparation products were designed with reproducibility in mind. At the heart of the range are products with a unique hybrid structure, comprising a porous plastic disc with embedded active materials to enhance sample cleanup and analyte recovery. Discover the range of sample preparation solutions including solid phase extraction (SPE), phospholipid removal (PLR) and supported liquid extraction (SLE).
Sponsored Content Policy: News-Medical.net publishes articles and related content that may be derived from sources where we have existing commercial relationships, provided such content adds value to the core editorial ethos of News-Medical.Net which is to educate and inform site visitors interested in medical research, science, medical devices and treatments.