Sponsored Content by PolytecAug 29 2019
Today, a vast number of micro-manufactured sensors, actuators and components vibrate at frequencies in the high MHz range. Some examples of these high-frequency vibrating systems include surface acoustic wave (SAW) filters and ultrasound sensors, such as those used in medical imaging, micro-electromechanical systems (MEMS) and nano-electromechanical systems (NEMS).
Measuring the dynamic behavior is one way to test the functionality of these components, to optimize the system design and to check existing simulation models. In these systems, one of the few available non-invasive solutions for vibration measurement involves using a laser vibrometer for measuring without contact.
Until recently, Polytec vibrometers usually reach a maximum measurement frequency of 24 MHz. Up to a frequency of 2,400 MHz, the new UHF-120 Ultra High Frequency Vibrometer makes it possible to easily and reliably determine vibration characteristics of high-frequency vibrating systems (Figure 1).
Figure 1. Typical frequency range of high-frequency components.
| Application |
Frequency range |
| RF-MEMS |
1 MHz - >3 GHz |
| SAW Filter |
10 MHz - >60 GHz |
| NEMS |
50 MHz - >1 GHz |
| HF Ultrasound |
Transducer 1 MHz - >1 GHz |
Principle and Design of the UHF-120 Ultra High Frequency Vibrometer
Like other Polytec vibrometers, the functioning principle of the UHF-120 is based on laser Doppler interferometry. When the laser beam from the vibrometer collides with a moving object, the frequency and phase of the light scattered back is shifted due to the Doppler effect. The frequency and phase shift is interferometrically determined.
The UHF-120 sensor head is based on the microscope (Figures 2 and 3) and contains a heterodyne Mach Zehnder interferometer. A beat signal is the result of interference of the Doppler shifted object beam with a reference beam. Beating is the interference of two coherent waves with a similar frequency. If the object oscillates backward and forwards, and moves in a line, a frequency and phase-modulated signal is generated, which contains all the information on the object’s vibration. Commercial oscilloscopes can digitize and sample the signal with a rate of up to 40 gigasamples/second. Subsequently, the digitized data is transferred to the PC via Ethernet, demodulated and then analyzed using the Polytec software.
The sensor head (1), the measurement computer (3), the oscilloscope (2) and a controller (4) as the interface between the measurement computer and the sensor head make up the complete UHF-120 system (Figure 3). On the occasion where the UHF-120 is used to make a scanned (surface) measurement, the total system is expanded by a motorized X/Y positioning stage.
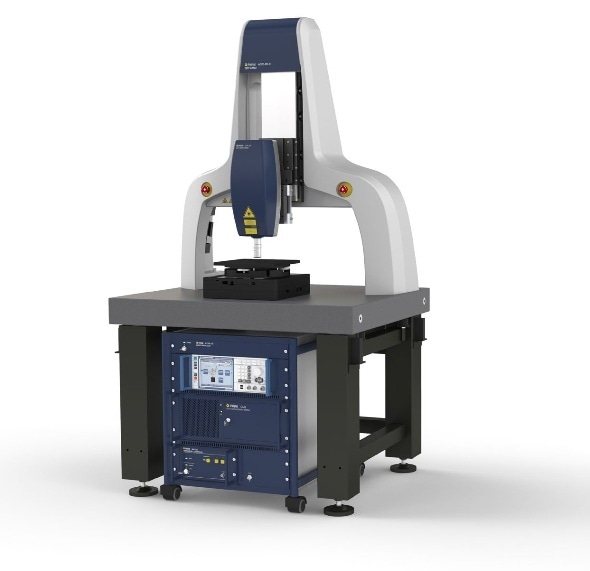
Fiture 2. UHF-120 with sensor head (1) and controller (4).
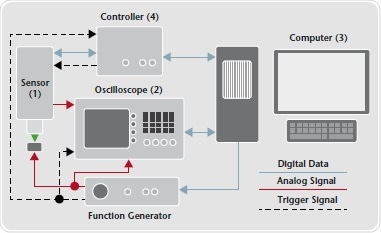
Figure 3. Information flow in total UHF-120 system.
Measuring Ultrasound Sensors
The Fraunhofer Institute for Biomedical Engineering (IBMT) in St. Ingbert developed both designs of the ultrasound sensors to be measured. These designs are used in medicine for abdominal imaging, cellular imaging and surface measurement. By measuring the out-of-plane vibration of the components, the goal is to determine the three-dimensional sound field dispersion in space.
Operating Principle of Ultrasound Sensors
Both of the ultrasound sensors work as receivers and transmitters of ultrasonic waves (ultrasound transducer). There is either a thin membrane (100 MHz Array) or an impedance-matching layer (5 MHz) above a piezo array, which depends on the function and mode of operation of the two arrays. The amplitude and the phase of deflection of each piezo field can be varied by applying a voltage to a distinct field of the piezo array. The crystal vibration (out-of-plane) produced by the piezo effect is transmitted to the matching layer above or the thin membrane.
The membrane or adapter layer excited to vibrate then generates an ultrasound wave. Then the shape and frequency can be altered by changing the control of the piezo field. It is possible to generate a focused ultrasonic wave with a variable point of focus with the low-frequency sensor, for example, by choosing the correct amplitude and phase for each array element.
Measurement Using the Low-Frequency Ultrasound Sensor (Sensor 1)
The low-frequency ultrasound sensor, with a surface component of around 10 x 10 mm2 and a 5 MHz vibration frequency, is used for abdominal imaging. When measuring the low-frequency sensor, a 5x objective was used. The field of view captured by the camera with a 5x objective is 1.42 x 1.1 mm2. Thirty individual fields (5 x 6) were scanned and measured one after the other to characterize the sensor across the whole surface of approx. 10 x 10 mm2.
In each area of interest (AOI), 234 measurement points were defined. The amplitude and phase were recorded at each scan point over a time period of 20 μs throughout the scan. The beginning of individual measurements were initiated by a trigger signal, whereby the signal is used simultaneously as the phase reference.
Individual scanned field data recorded in this way were then merged and animated using the Polytec software. Figures 4 to 11 show an excerpt of the animation of the vibration progress. The total vibration time is around 5 μs with a maximum peak-to-peak amplitude of ±40 nm and the amplitude time profile of a selected measurement point is displayed in Figure 12. It is possible to generate ultrasonic waves in certain shapes with the regulated excitation of a piezo array and a thin impedance-matching layer above it, as demonstrated in the images.
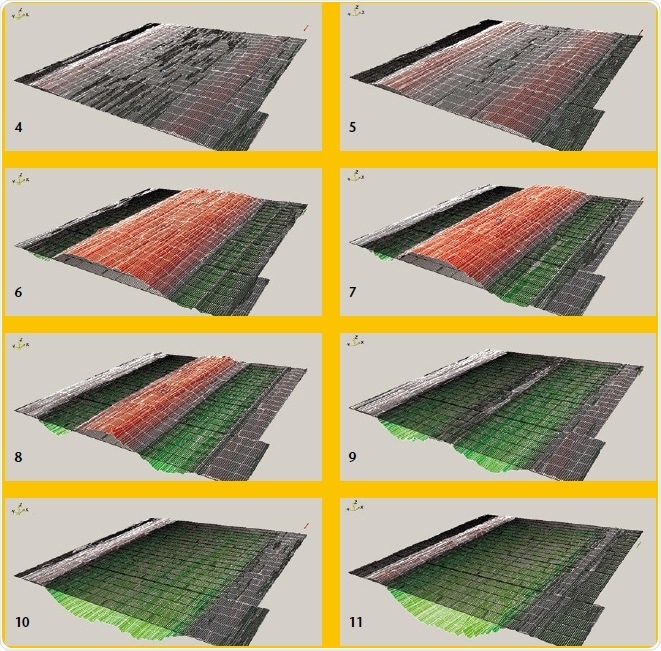
Figure 4 – 11. Vibration characteristics of the low-frequency ultrasonic sensor.

Figure 12. Amplitude time profile of a selected measurement point.
Initially, you will recognize that the edge areas and subsequently the middle areas of the membrane are excited to vibrate when analyzing the vibration profile in the first four individual images. Therefore, the outer part of the ultrasonic wave begins earlier than the middle part. Consequentially, you obtain the desired type of spherical wave, which runs into a focal point after a certain distance.
Data Analysis at the IBMT
The development team at IBMT ascertained that the principle vibration behavior of the membrane matched the existing simulations from the initial animations of the measurement data with the Polytec software.
Detailed analysis of the measurement data ensured that the existing vibration model was refined. During the measurement, it had to be considered that the membrane was not operated in water, as it would be in reality, but in air without the damping normally created by the water.
It is currently possible for the IBMT to simulate the vibration of the membrane and the three-dimensional propagation of the ultrasonic wave produced due to the revised simulation model. It is now conceivable to evaluate the function of the component in a considerably shorter time as an alternative to the traditional measurement of the three-dimensional noise field.
Measurement Using the High-Frequency Ultrasound Sensor (Sensor 2)
For cellular imaging and surface measurements, the high-frequency ultrasound sensor is used, which has a surface of approx. 0.8 x 2.4 mm2 and a vibration frequency of 105 MHz. Three individual areas had to be scanned and measured one after the other using the 10x objective when measuring the sensor and each AOI was given 405 sample points. This measurement was covered with a 1 mm thick layer of water, on top of which there was also a thin piece of cover glass, in contrast to the measurement of the low-frequency sensor, allowing a realistic recording of the transducer measurement.
With the low-frequency sensor, a focused ultrasonic wave is generated by the vibration of the membrane. Comparatively, the high-frequency sensor can only cause simultaneous excitation of the elements and thus a scan can be conducted. Depending on which contacts are controlled on the sensor (figure 13), various areas of the membrane are excited to vibrate. Therefore, with a “scanning ultrasonic measurement“, different areas of the membrane can vibrate in phase with each other, transmitting level sound waves at various positions. Sound waves generated in such a manner are detected again via ultrasound sensor and reflected in the test object.
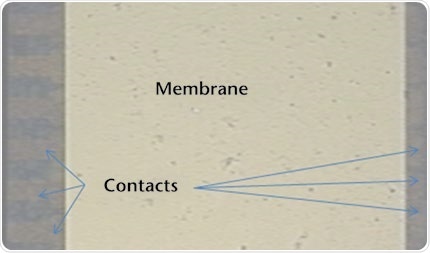
Figure 13. Microscope shot of the high-frequency ultrasonic sensor with a 1 mm thick layer of water and a cover glass.
Figures 14–22 display the results after excitation of the four piezo fields in the middle of the ultrasound transducer. The piezo array generates the membrane surface vibration over a defined area. Figure 14 shows that the maximum amplitude of the membrane corresponds to a bit more than 150 pm and the settling process of the membrane vibrating is around 0.5 μs at around 105 MHz. It can clearly be seen that as a result of the strong attenuation by the layer of water, based on the membrane deflection shape, an almost flat and simultaneously spatially focused sound wave is produced by the membrane and only the area of the membrane excited by the piezos directly beneath it will start vibrating.
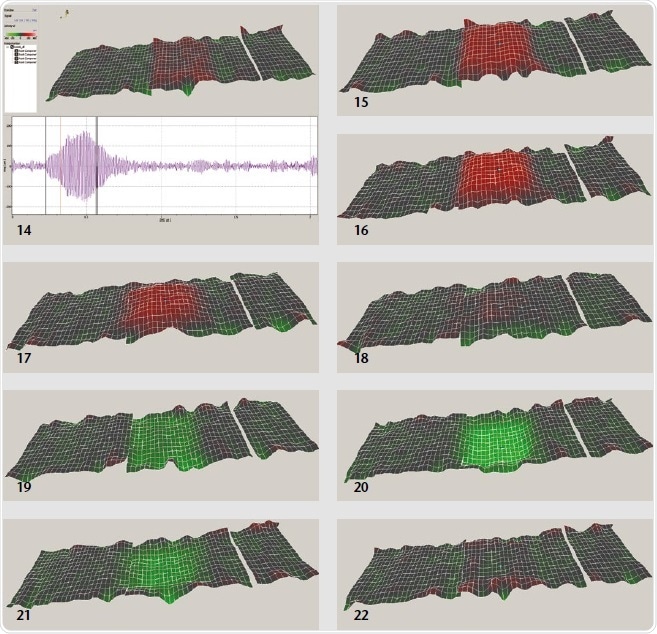
Figure 14 – 22. Vibration Characteristics of the highfrequency ultrasound sensor.
Data Analysis at the IBMT
It was also possible for the IBMT to spatially simulate the sound field generated using a model based on the out-of-plane vibration measured in the water1. The water measurement thus serves as a realistic basis for the simulated sound field.
Summary
It is fairly easy to precisely control the vibration characteristics of high-frequency vibrating systems with the UHF-120 vibrometer. The time required to determine the ultrasonic field through surface measurement of the transducer can be significantly reduced at the IBMT. A notable advantage of the UHF-120 is the small amount of time needed, which can be decisive in the development process, apart from the high accuracy of the measurement procedure. The resulting sound field can be determined with one or more scanned measurements and subsequent simulation as an alternative to measuring the three-dimensional sound field using a noise sensor installed in the room.
Reference
1 It was necessary to ensure that the sensor in the reference system moved in water during the analysis of the high-frequency sensor results. The optical path that the light takes is calculated from the geometric path multiplied by the refractive index. Water with a refractive index of n = 1.33 has a superior refractive index than air (n = 1), so the optical path of the light in water in a factor of 1.33 greater and the vibrometer measures a path that is a factor of 1.33 too big. You have to divide all the measurement results by 1.33 to reach the correct amplitude value, which, can be easily done by the PSV software with the aid of the signal processor.
About Polytec

For over 40 years Polytec has provided high-technology, laser-based measurement solutions to researchers and engineers. Our commitment is to provide the most precise and reliable optical instruments and sensors available for non-contact measurement, setting Polytec apart from the competition as the gold standard in the design and manufacture of vibrometer and velocimeter systems. Our innovations answer many pressing manufacturing and engineering challenges.
Polytec was founded in 1967 to distribute commercial laser technology to industrial and research markets. Building on the company’s early success, Polytec began to develop and manufacture innovative laser-based test and measurement instruments in the 1970’s. These products have become known around the world as the gold standard in non-contact, laser-based measurement of vibration, speed and length.
Advanced product development remains a core strategic activity at Polytec with new electro-optical systems being designed for applications such as analytical process measurement, noise analysis, and factory automation.
In addition, Polytec continues to develop its key business structure through critical technology acquisitions and focused spin-offs. Some of the most recent highlights include:
In 2005, Polytec PT GmbH Polymere Technologien was founded as a spin-off, with over 30 years of know how in the supply and application of high tech adhesives and silicones in demanding electronic, optical and medical industries.
In 2008, LATAB was acquired and became a member of the Polytec organization. LATAB's early entry into the LED illumination market has produced the broadest and most flexible product mix for technical applications.
Sponsored Content Policy: News-Medical.net publishes articles and related content that may be derived from sources where we have existing commercial relationships, provided such content adds value to the core editorial ethos of News-Medical.Net which is to educate and inform site visitors interested in medical research, science, medical devices and treatments.