Real-time and in-line accurate measuring of protein (monoclonal antibody, or mAb) concentration has been shown across a wide dynamic range (0–135 g/L) through the use of a Raman process analyzer for the ultrafiltration/diafiltration (UF/DF). See Figure 1 for a diagram.
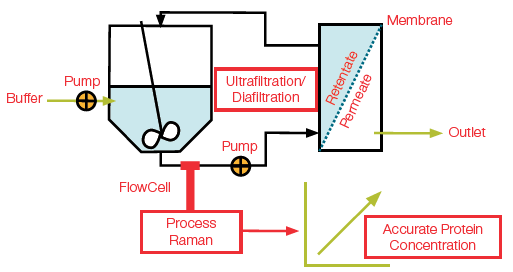
Figure 1. Diagram showing integration of process Raman in a UF/DF process using a flowcell probe for in-line estimation of accurate protein concentration. Image Credit: Thermo Fisher Scientific – Portable and Handheld Raman Spectroscopy
This paper describes a methodology that provides actionable results for downstream processing and offers important insights into controlling and monitoring protein concentration. It also demonstrates that the Raman models created for measuring mAb concentration can be transferred to a similar class of mAbs.
Introduction
Therapeutic proteins, such as insulin, mAbs, Fc-fusion protein, hormones, and antibody-drug conjugates, treat numerous conditions and diseases, including immunologic diseases, cancer, and communicable diseases like COVID-19.1
The functionality and efficacy of a therapeutic protein depend on the dosage, structure, and physical state. Sudden environmental changes near the protein, like varying temperature, pH, shear force, or chemical modification, can cause conformational alterations within the protein.
These changes in structure can result in protein denaturation, aggregation, and, in some cases, degradation, all offering the potential to reduce the efficacy of the therapeutic protein or instigate undesired health issues for the patient. Ensuring the quality and quantity of therapeutic proteins during the entire manufacturing process—including production, the fill and finish stage, and throughout storage—is crucial.2
Therapeutic proteins such as mAbs are created in a bioreactor where cells are kept in ideal conditions by controlling physical and nutritional factors like temperature, pH, and dissolved oxygen; the controlled environment of the bioreactor results in improved mAb production.
After the upstream process, operations such as centrifugation, concentration, viral inactivation, filtration, chromatography, buffer exchange, formulation, and fill and finish are completed to purify the mAbs and formulate them into drug products. These operations are collectively known as downstream processes (Figure 2).
This study sees a Thermo Scientific™ MarqMetrix™ All-In-One Process Raman Analyzer placed in a UF/DF run (Figure 1) to be used as a solution for in-line process analytical technology (PAT) for measuring mAb concentration.
In-line PAT allows for real-time monitoring and control over crucial process parameters essential for limiting batch-to-batch process variations and guaranteeing uniform products. Good process control implies product quality, high efficiency, and minimized manufacturing costs.3
Today, ultraviolet-visible (UV-Vis) spectrometry is the go-to technology for in-line quantification of protein concentration in downstream purification.4 Recently, however, process Raman has increased in popularity as a complementary technology for in-line monitoring of protein concentration with the added benefits of measuring buffer components, excipient concentrations, and critical quality attributes (CQAs) of products.5
Below is a demonstration of using process Raman as a viable PAT solution for accurate, real-time quantification of mAb concentration throughout downstream processing. The model's transferability to a different mAb is also shown.
Experimental design and data analysis
Calibration model development
Partial least square (PLS) calibration models for mAb quantification were created using Product A calibration samples from 0 to 135 mg/mL concentrations. The samples were run through the FlowCell probe combined with process Raman at a 100 mL/min flow rate. The Raman spectra were gained with a 785 nm laser with these acquisition parameters: laser power 450 mW; integration time 3000 ms; average three (i.e., a single spectrum per 18 s); and 10 replicates per concentration.
PLS models were created for mAb quantification utilizing two spectral regions. The “Amide I PLS model” used a spectral region of approximately 1550 to 1850 cm-1, while the “Extended Region PLS model” used a wider spectral region from around 850 to 1850 cm-1. The terminal region of the spectra (~3098 to 3230 cm-1) that corresponds to water band vibrations was also incorporated into the normalization model.
The models were constructed after performing the data preprocessing steps: 1) normalization to the water band in every spectrum using infinity norm; 2) SavGol filter 1st derivative (smoothing window 13 and polynomial order two); and 3) mean centering. The models were internally validated with a leave-one-out cross-validation strategy (contiguous block of 10).
At first, the two models were constructed using the latent variables from 1 through 20. Then, the root mean square error of calibration (RMSEC) and the root mean square error of cross-validation (RMSECV) were calculated for each model individually.
As a final step, the optimum latent variable PLS model was chosen through the following criteria: 1) adding more latent variables did not significantly improve the RMSECV; 2) the values of RMSEC and RMSECV were similar.
To evaluate the specificity of each model, the variable importance in the projection (VIP) scores was deduced for both models. All chemometric works were completed utilizing Solo 9.3 (2024) Eigenvector Research, Inc., Manson, WA USA 98831 software.
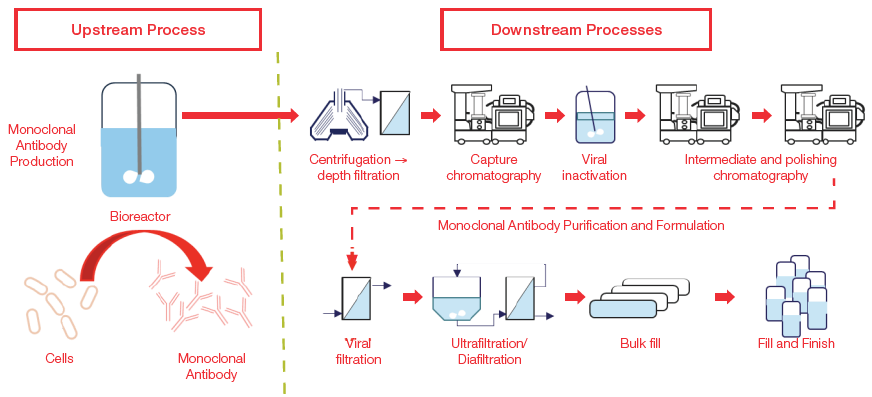
Figure 2. Upstream and downstream workflow for production of monoclonal antibodies. Image Credit: Thermo Fisher Scientific – Portable and Handheld Raman Spectroscopy
Validation of model performance
The Raman spectra of each test sample were collected for two unique mAbs (products A and B) through the procedure depicted in the training data. The formulation buffers differed for products A and B throughout the diafiltration steps. The spectra were introduced into the models to arrive at real-time predictions for protein concentration.
The predicted concentrations were subsequently compared with the reference in-line and offline UV-Vis values to estimate the prediction error.
Results
Figure A3 shows a correlation plot between measured and predicted (during cross-validation) protein concentrations for the Amide I PLS models. The Amide I PLS model uses four latent variables, as adding more latent variables did not improve the RMSECV (data not shown).
The RMSEC and RMSECV for the Amide I PLS model were 0.526 mg/mL and 0.607 mg/mL, respectively. The ratio of RMSEC and RMSECV being close to 1 indicates that the model is not overly fitted. Correspondingly, the R2 of CV is near one, and minimal CV bias is indicative that the model fits well with the training data. Table 1 summarizes the model statistics.
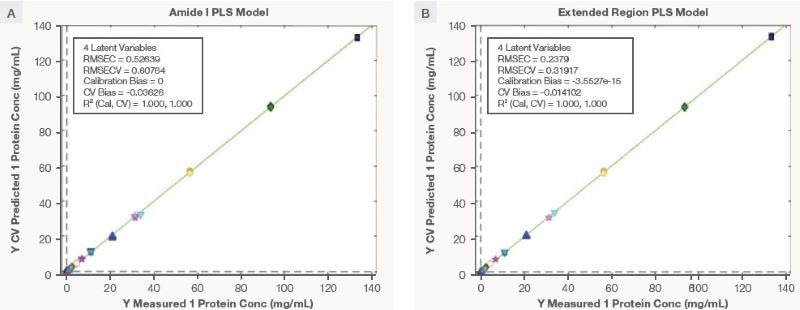
Figure 3. The correlation plot for measured and cross validation predicted protein concentration for mAb using Amide I and Extended Region PLS model. Image Credit: Thermo Fisher Scientific – Portable and Handheld Raman Spectroscopy
Source: Thermo Fisher Scientific – Portable and Handheld Raman Spectroscopy
| PLS Model |
Latent Variables |
RMSEC (mg/mL) |
RMSECV (mg/mL) |
CV Bias |
R2 CV |
| Amide I PLS model |
4 |
0.526 |
0.607 |
-0.036 |
~1 |
| Extended Region PLS model |
4 |
0.237 |
0.319 |
0.014 |
~1 |
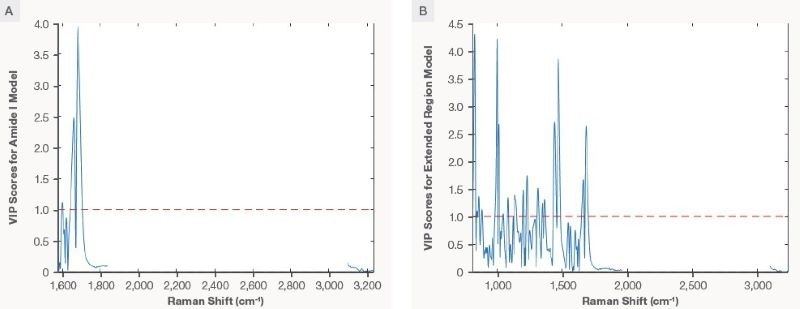
Figure 4. The VIP scores plot for Amide I PLS model (plot A) and Extended Region PLS model (plot B). Image Credit: Thermo Fisher Scientific – Portable and Handheld Raman Spectroscopy
The Amide I model is predominantly based on the Raman signature of the carbonyl group (–C=O) of the peptide bond (–CO–NH–) of mAbs. The carbonyl group on various secondary structures has different Raman shifts from 1600 to 1750 cm-1. The mAb secondary structure is predominantly a β-sheet structure. The carbonyl in the β-sheet secondary structure has a Raman peak at ~1670 cm-1.
With this information, it can be hypothesized that the Raman shift at ~1670 cm-1 should influence the Amide I PLS model. The calculated VIP scores help examine the influence of each Raman shift on the model. Raman shifts with VIP scores higher than one are considered significant for the model. Figure 4A indicates the VIP scores plot for the Amide I PLS model. The red dotted line represents the threshold of a VIP score equal to 1.
The region between 1640 and 1700 cm-1 exhibits VIP scores greater than one, influencing the model. The region of approximately 1670 cm-1 has the highest VIP score in the Amide I PLS model. This is indicative that the carbonyl Raman signature in the β-sheet secondary structure exhibits great dominance on the Amide I PLS model. The VIP scores plot for the Amide I PLS model shows that the model has high specificity for mAbs.
Using published work as a base, the Amide I region of mAbs is unique. It has an obvious Raman signature compared to other commonly used molecules like excipients and buffers in the downstream processes. No spectral interference in the Amide I region is suggestive that the Amide I PLS model is across different matrixes. Most mAbs also have similar mass (a similar number of carbonyl residues) and secondary structure.
This result shows that the Amide I PLS model has transferability across multiple mAbs within the same classes, which was the basis for the intent to develop the Amide I PLS model. The correlation plot for the four latent variables of the Extended Region PLS model is seen in Figure 3, and there is a summary of model statistics in Table 1.
Like the Amide I PLS model, the Extended Region PLS model’s superior statistics indicate that it can capture spectral information and correlate it with the measured concentration. The VIP scores plot for the Extended Region PLS model is seen in Figure 4B.
In addition to the Amide I region, this model is influenced by the Raman shift in correspondence to the CH deformation (~1450 cm-1), the breading mode of the phenylalanine ring (~1005 cm-1), and the tyrosine vibration mode (~850 cm-1). The VIP scores plot for the Extended Region PLS model shows the model's specificity for mAbs.
The RMSEC and RMSECV for the Amide I PLS model are greater than the Extended Region PLS model, seen in Table 1, which is indicative that the former model provides less accuracy than the latter. The Extended Region PLS model uses more variables (Raman shifts) to explain the information in the training dataset.
Although the Extended Region PLS model offers greater accuracy, in some situations, its transferability over different matrices can result in more prediction errors caused by spectral overlap. Each model has pros and cons; one may be a better choice depending on requirements.
Performance of models on the UF/DF run using product A (mAb)
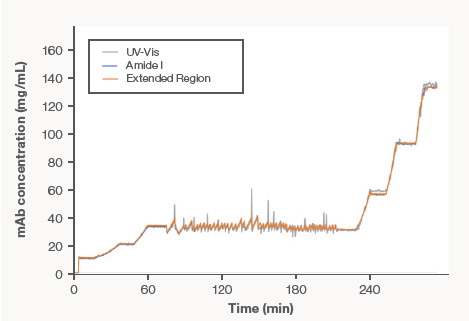
Figure 5. Showing excellent correlation of the real-time monitoring of UF/DF of product A. Image Credit: Thermo Fisher Scientific – Portable and Handheld Raman Spectroscopy
The prediction of protein concentration in real-time throughout the process of UF/DF utilizing data from the Amide I PLS model (blue trace), in-line UV-Vis (grey), and Extended Region PLS model (orange) is shown in Figure 5. The figure shows all three predictions laid over the other and demonstrates excellent agreement.
Small data discrepancies between in-line UV-Vis and Raman were noted. The Raman data was obtained every 18 seconds, whereas the in-line UV-Vis data was acquired every 12 seconds. The UF/DF process is greatly dynamic, meaning the difference in acquisition times explains the discrepancies; these discrepancies are easily overcome with appropriate process controls of the dynamics or acquisition settings.
Lastly, the Raman prediction from both models was analyzed alongside the offline UV-Vis reference values, where the absolute prediction errors remained below 5 % during the process.
Transferability of models on product B (mAb) UF/DF run
The Amide I and Extended Region PLS models were created with the data set from Product A. A UF/DF run was completed with a performance of the model and other mAbs. Figure 6A indicates the real-time monitoring and prediction of Product B concentration throughout the UF/DF process utilizing Amide I and Extended Region PLS models.
The predictions from the Extended Region Model (orange trace) and the Amide I model (blue trace) overlay each other well. On the right side of Figure 6B, the absolute prediction error between the reference (offline UV-Vis) and the predicted (Raman) is demonstrated as a function of protein concentration. The orange and blue bars represent the prediction errors from the Extended Region PLS models and the Amide I PLS, respectively. The prediction errors overall were less than 3 % across the tested concentration range.
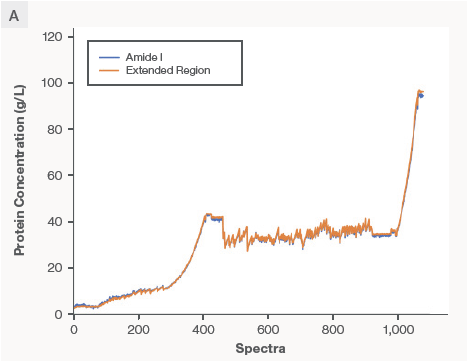
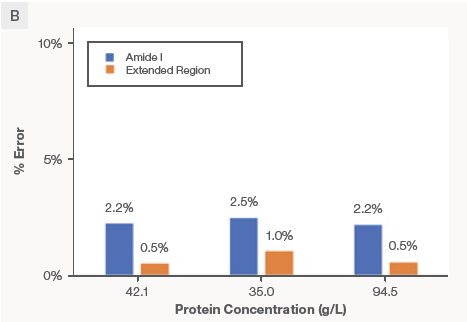
Figure 6. Data demonstrate excellent model transferability between proteins with different formulation matrices. The calibration models for predicting protein concentration were built with Product A and applied to Product B that has a different formulation buffer. The absolute prediction error was < 3 %. Image Credit: Thermo Fisher Scientific – Portable and Handheld Raman Spectroscopy
Conclusions
Process Raman is quick, reliable, and easy to use as a PAT solution for in-line monitoring of protein concentration throughout downstream processes, with accuracy levels comparable to the reference values from in-line and offline UV-Vis instrumentation.
This study outlined two methods for developing chemometric models for quantifying mAbs based on specified Raman signatures. Due to the high specificity of both models for mAbs, they were also demonstrated to have excellent transferability to a different mAb in a UF/DF run, no matter the differences in buffer formulations.
Based on published works, process Raman is a wider PAT solution for downstream applications due to the additional benefits provided, such as measuring buffer components, crucial quality attributes of proteins (aggregation, disulfide region, secondary structure), protein modification (antibody-drugs conjugates), formulation components, and more.6-8
References
- Leader, B.; Baca, Q. J.; Golan, D. E. Protein Therapeutics: A Summary and Pharmacological Classification. Nat Rev Drug Discov 2008, 7 (1), 21–39. https://doi.org/10.1038/nrd2399.
- Alt, N.; Zhang, T. Y.; Motchnik, P.; Taticek, R.; Quarmby, V.; Schlothauer, T.; Beck, H.; Emrich, T.; Harris, R. J. Determination of Critical Quality Attributes for Monoclonal Antibodies Using Quality by Design Principles. Biologicals 2016, 44 (5), 291–305. https://doi.org/10.1016/j.biologicals.2016.06.005.
- Research, C. for D. E. and. PAT — A Framework for Innovative Pharmaceutical Development, Manufacturing, and Quality Assurance. U.S. Food and Drug Administration. https://www.fda.gov/regulatory-information/search-fda-guidance-documents/pat-framework-innovative-pharmaceutical-development-manufacturing-and-quality-assurance (accessed 2023-03-21).
- Rolinger, L.; Rüdt, M.; Hubbuch, J. Comparison of U.V.- and Raman-Based Monitoring of the Protein A Load Phase and Evaluation of Data Fusion by PLS Models and CNNs. Biotechnol Bioeng 2021, 118 (11), 4255–4268. https://doi.org/10.1002/bit.27894.
- Rolinger, L.; Rüdt, M.; Hubbuch, J. A Critical Review of Recent Trends, and a Future Perspective of Optical Spectroscopy as PAT in Biopharmaceutical Downstream Processing. Anal Bioanal Chem 2020, 412 (9), 2047–2064. https://doi.org/10.1007/s00216-020-02407-z.
- Sukumaran, S. Protein Secondary Structure Elucidation Using FTIR Spectroscopy. 4.
- Dolui, S.; Mondal, A.; Roy, A.; Pal, U.; Das, S.; Saha, A.; Maiti, N. C. Order, Disorder, and Reorder State of Lysozyme: Aggregation Mechanism by Raman Spectroscopy. J.Phys. Chem. B 2020, 124 (1), 50–60. https://doi.org/10.1021/acs.jpcb.9b09139.
- Hernández, B.; Pflüger, F.; López-Tobar, E.; Kruglik, S. G.; Garcia-Ramos, J. V.; Sanchez-Cortes, S.; Ghomi, M. Disulfide Linkage Raman Markers: A Reconsideration Attempt: Disulfide Raman Markers. J. Raman Spectrosc. 2014, 45 (8), 657–664. https://doi.org/10.1002/jrs.4521.
About Thermo Fisher Scientific – Portable and Handheld Raman Spectroscopy
Thermo Fisher Scientific offers innovative solutions that help our customers solve complex analytical challenges, accelerate life sciences manufacturing, deliver medicines to market, and increase laboratory productivity. Our Thermo Scientific portable and handheld process Raman analyzers enable accurate, real-time results for process monitoring.
Our Thermo Scientific™ MarqMetrix™ All-In-One Process Raman Analyzer is an all-in-one system purpose-built for rapid deployment, ease of use, and scalability in markets where time-to-results is critical. The Ramina Process Analyzer is designed for:
- Analysis without sample preparation, delivering Raman spectral results in real-time
- Easy setup and deployment by non–Raman spectroscopists
- Non-destructive workflows to protect precious samples
- Non-invasive handling to minimize contamination of samples
- Small footprint for convenient deployment
- Factory calibration for hardware stability and portability
Our Thermo Scientific TruScan G3 Handheld Raman Analyzer includes state-of-the-art optics paired with a patented multivariate residual analysis that offers an effective chemometric solution for material identification, with two spectral pre-processing options. The analyzer’s non-destructive point-and-shoot sampling principle facilitates rapid verification of a broad range of chemical compounds, including cellulose-based products.
The Thermo Scientific TruScan G3 Handheld Raman Analyzer takes pharmaceutical manufacturing QA/QC to the next level with:
- Enhanced 21 CFR Part 11 and cGMP compliance with biometric login, complex password options, and full audit trail features
- Non-contact analysis through plastic bags, glass containers, blister packs and clear gel caps
- Intuitive workflow adapted to production environment through PDF batch reports and ease of data input using barcode scanners
- Easy fleet management feature that enables cloning of instruments and identification methods
Sponsored Content Policy: News-Medical.net publishes articles and related content that may be derived from sources where we have existing commercial relationships, provided such content adds value to the core editorial ethos of News-Medical.Net which is to educate and inform site visitors interested in medical research, science, medical devices and treatments.