Magnetic resonance imaging (MRI) is among the most commonly used imaging methods in preclinical studies as it non-invasively produces multiparametric data of tissues and organs. An animal organism’s small dimensions necessitate high spatial resolution, equating to high demands on the signal-to-noise ratio (SNR).
MRI systems are built to capture images with high SNR by utilizing magnets that operate at high and ultra-high fields and utilize dedicated radiofrequency coils and scanner electronics. Yet, the quality of MRI images can be impacted by thermal object and receiver noise regulated by individual hardware settings, the type of tissue that has been imaged, and sequence parameters.
Noisy images can stem from experimental conditions when: (i) small voxel volumes are utilized to spatially resolve specific structures (ii) averaging might be either undesirable or impractical, (iii) approaches that necessitate signal attenuation for contrast generation such as diffusion MRI and relaxometry, or (iv) parallel imaging approaches are applied.1,4.
Images with a lot of noise may pose as obstacles in visual interpretation and result in a sensitivity that is too low to identify small signal fluctuations, like in functional MR experiments.
Processing approaches like registration or conducting quantitative MRI, e.g., tensor estimation in diffusion tensor imaging, can be more difficult.3 Denoising algorithms to enhance qualitative and quantitative measures of noisy images are thus employed more and more in MRI.5
Smart noise reduction
With ParaVision 360 V3.6, Bruker introduced Smart Noise Reduction, a new image reconstruction practice for diminishing and removing noise from MRI images. The Smart Noise Reduction image reconstruction process is built upon residual convolutional neural networks familiar with the noise structure, which can be removed from the original data.
The networks were trained via supervised learning without any generative method. A data consistency factor permits an adjustable denoising level, avoiding over-smoothing and preserving image contrast. Utilizing this data consistency and an iterative denoising (Pre-Denoising) approach can significantly increase final image quality.
The Smart Noise Reduction comprises three neural networks that differ in structure and size for denoising. While small network size (network Quick) has the speediest processing times, the more robust structures (networks Strong and Large) diminish the need for noise characteristics.
Fig 1 displays exemplary denoising outcomes from these three networks. A denoised 3D dataset was used as a reference to show the effects of denoising with the various networks.
Two levels of simulated noise (Standard deviation 0.05 and 0.1) were added to the reference image, which was later utilized as input for the three denoising networks (Quick, Strong, and Large). All of the datasets were denoised with 50% pre-denoising and a 100% denoising level.
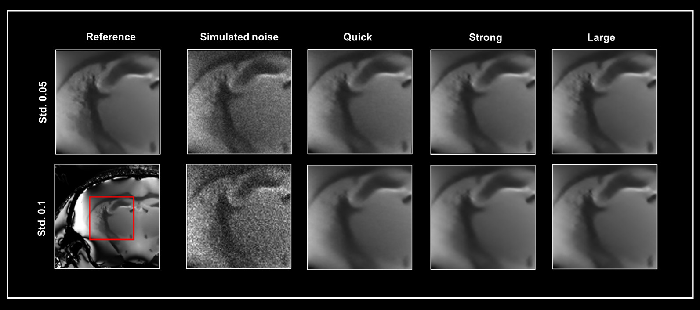
Figure 1. Smart Noise Reduction using different neuronal networks. A denoised 3D dataset was taken as ground truth (Reference) to which two varying levels of simulated noise were added, i.e. standard deviation (Std.) 0.05 and 0.1, respectively. Noisy data were subsequently reconstructed with the Quick, Strong, and Large networks. All data were denoised with a 100% denoising level and 50% pre-denoising. The area shown in the red box was selected for the similarity metrics in Table 1. Image Credit: Bruker BioSpin Group
Performance evaluation
A key challenge to performing denoising on structural MR images lies in diminishing the amount of noise while maintaining the details, edges, and small structures that could be critical for interpreting and analyzing the image. Furthermore, the procedure should not introduce image artifacts or add characteristics not present in the subject.
To quantify the quality of the reconstructed images displayed in Fig. 1, the Peak Signal to Noise Ratio (PSNR) and Structural SIMilarity (SSIM) index between the reference image and the data reconstructed with the three distinct networks were quantified (displayed in Table 1).
Fig. 1 displays the chosen region for the analysis. Although implementing the large network provides optimal performance, the Quick and Strong networks also produce good-quality images.
Table 1. Quantitative comparison of performance of three neuronal networks for Smart Noise Reduction. For the SSIM index 0 indicates no similarity and 1 indicates perfect similarity. Bold indicates the best performing network. Source: Bruker BioSpin Group
| Noise |
Metric |
Quick |
Strong |
Large |
| Std. 0.05 |
PSNR |
37.272 |
38.592 |
39.152 |
| SSIM |
0.9439 |
0.9657 |
0.9711 |
| Std. 0.1 |
PSNR |
34.239 |
35.380 |
35.939 |
| SSIM |
0.9332 |
0.9483 |
0.9531 |
Beyond the choice of network, choosing a denoising level is also possible. Fig. 2A shows the effect of applying different denoising levels for reconstructing images. Mouse brain data was obtained ex vivo, and the original data was reconstructed without denoising and while heightening denoising levels (70-100%).
Increasing denoising levels progressively removed noise from images. No artifacts were introduced throughout the procedure. Computing a difference image between the source and 70% denoised images showed that noise alone was selectively removed.
If the original signal at the image edges is lower due to factors such as bandwidth selection or high denoising levels (i.e., 90 and 100%), the edges can appear blurry. Thus, the ideal denoising level, producing a trade-off between efficient noise removal and edge blurring, should be established individually for each dataset or for each application protocol at a minimum.
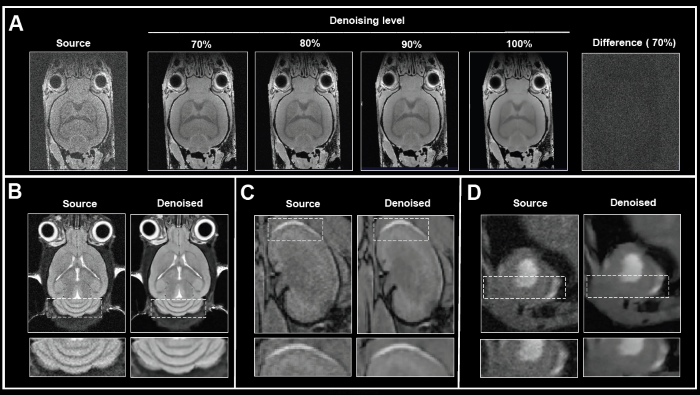
Figure 2. The effect of image denoising on image quality. A) Applying increasing levels of denoising. Shown are axial images of a 3D T1-weighted FLASH ex vivo data of a fixed mouse head acquired at 9.4 Tesla without (Source) and different levels (70-100%) of denoising. A difference image between the source and 70% denoised images was computed. B)-D) Comparison of in vivo images reconstructed with no denoising and with 70% denoising. B) Coronal T2-weighted TurboRARE images of a mouse brain acquired at 3 Tesla. C) Coronal 3D FISP images of mouse kidney acquired at 7 Tesla. D) Short axis view of a mouse heart acquired with a flow-compensated triggered FLASH sequence at 9.4 Tesla. For different data, either no denoising (Source) or denoising using individual networks and a pre-denoising of 50% was applied (Denoised). Image Credit: Bruker BioSpin Group
The usefulness of Smart Noise Reduction was shown in-vivo mouse data of different organs obtained at various magnetic field strengths (Fig. 2B-D). Compared to the reference images of the brain, kidney, and heart, reconstruction with 70% denoising provided images with considerably less noise and improved appearance of anatomical details and edges.
To test the denoising algorithm’s performance with images of different levels of tissue contrast, ex vivo data of a fixed mouse brain was obtained with a nominal voxel size of 55 x 55 x 800 µm3 at 3 Tesla, either without any averaging or 4 or 15 averages (as shown in Fig. 3).
This equates to a contrast-to-noise ratio between the corpus callosum and cortex of 2.47±0.45, 4.59±0.01, and 12.03±0.81, respectively. Images were reconstructed both without and with 70% and 100% denoising.
Given the somewhat high resolution, the image without averaging shows low tissue contrast and contains noise that can be reduced via averaging during acquisition or with denoising during image reconstruction. Yet, comparing obtained denoised images with different averages shows that denoising can increase spurious contrast in cases with low tissue contrast, i.e., no averaging, such as in Fig. 3, arrow.
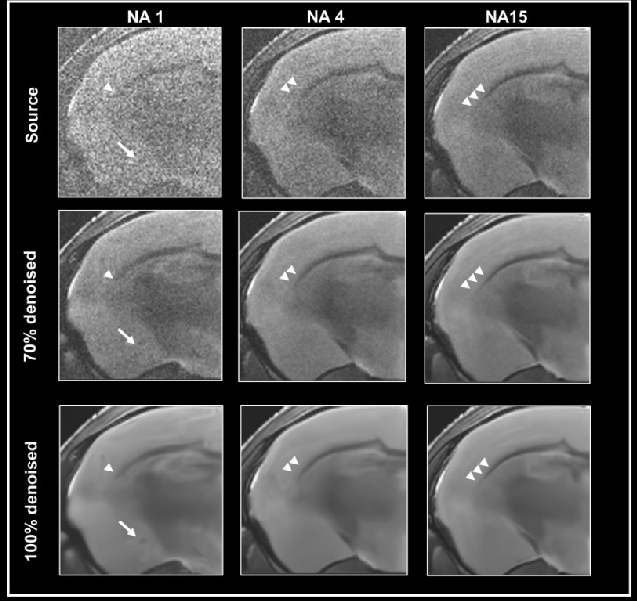
Figure 3. Denoising images with low tissue contrast. A) Axial T2-weighted TurboRARE images of a fixed mouse head were acquired at 3 Tesla with 1, 4 and 15 number of averages (NA), respectively. Images have a nominal voxel resolution of 55 x 55 x 800 μm3. Image reconstruction was performed without (Source) and with 70% and 100% denoising. Each denoised image was reconstructed with a network Strong and a pre-denoising of 50% was applied. The arrows point to a structure in the NA1 images, that is faintly visible in the image that has not been denoised and that becomes more apparent with increasing denoising. The arrowheads point to the corpus callosum which becomes more visible. Resolution of fine structure requires high tissue contrast with averaging. Image Credit: Bruker BioSpin Group
This structure, which is faintly visible in the noisy image without denoising but not easily distinguished from the surrounding tissue, is enhanced by heightening levels of denoising. Comparing images using different averaging levels shows that with denoising, the corpus callosum becomes more visible (as shown in Fig. 3, arrowheads). However, resolving the fine structures of the corpus callosum’s limits necessitates high tissue contrast with averaging. If this is provided, denoising can enhance the visualization.
Faster imaging
Obtaining MRI data is a slow process, and acquisition times increase alongside higher spatial resolution when extensive volumetric coverage is needed and/or multiple contrast images or quantitative data sets are gathered. Acquiring high SNR data in a reasonable amount of time is highly sought after. Here, Bruker showcases the use of Smart Noise Reduction to denoise fast structural brain scans.
Fig. 4 displays examples of ex vivo brain scans of different contrasts and orientations gathered in less than 5 minutes. The data was obtained from 3, 7, and 9.4 Tesla tools. To achieve the desired short acquisition time, standard protocols prepared for each system were improved by removing averaging, as seen in Fig. 4A-C.
This resulted in 7-15 times faster acquisition times compared to the original protocols. Yet, given the chosen resolution, no averaging resulted in noisy images. Reconstructing the obtained data with the denoising algorithm successfully removed noise from images and delivered high-quality images.
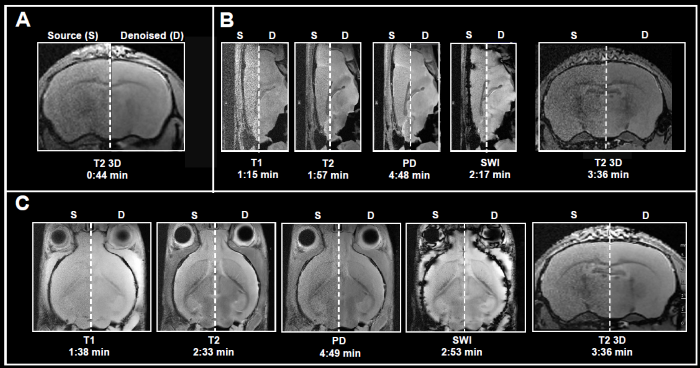
Figure 4. Examples of fast brain scans. Ex vivo data of a fixed mouse head acquired with different image contrasts, geometries and orientations. Data were acquired at A) 3 Tesla, B) 7 Tesla, and C) 9.4 Tesla. Images were reconstructed with no denoising (Source) and with a network Strong and applying 50% pre-denoising and a denoising level of 70% (Denoised). Image Credit: Bruker BioSpin Group
Multiple methods to accelerate MRI acquisitions by employing temporal or spatiotemporal redundancy of the images have been used in the literature.6 Approaches such as parallel imaging deliver structured noise in the reconstructed image as the decreased data sampling and noise amplification result from the parallel reconstruction algorithm.1
Ex vivo brain data were obtained with either partial Fourier or the multi-coil generalized auto-calibrating partial parallel acquisition (GRAPPA) approach (Fig. 5). Data obtained without acceleration served as a reference. Acceleration translated into an up to 3-fold decrease in acquisition times compared to the protocol when no averaging was used.
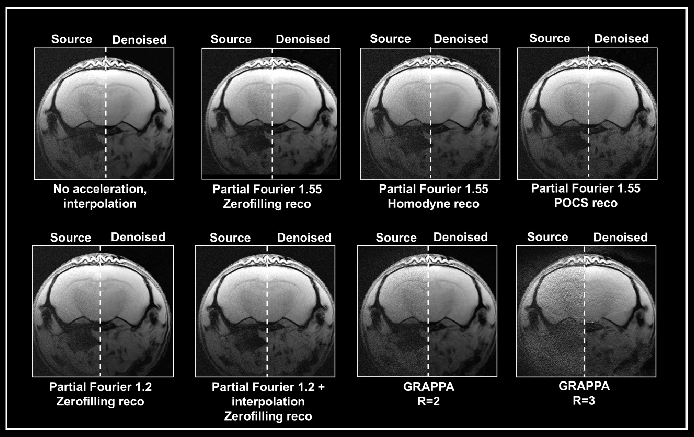
Figure 5. Denoising of accelerated brain data. Ex vivo T1-weighted FLASH data of a fixed mouse head were acquired at 9.4 Tesla. Data were either acquired with no acceleration, with partial Fourier (in Read), partial Fourier and interpolation (1.35 in Read and Phase), or with multi-coil parallel imaging technique GRAPPA. For GRAPPA, an acceleration factor (R) of 2 and 3 was chosen, respectively. Partial Fourier images were reconstructed either with zerofilling, homodyne, or POCS, as indicated. All images are shown with no denoising (Source) and after denoising (Denoised) with a Strong network, applying a pre-denoising level of 50% and denoising level of 70%. Image Credit: Bruker BioSpin Group
A denoising level of 70% led to more residual noise in data obtained with a partial Fourier 1.55 compared to data obtained without acceleration. The effect was most significant in homodyne-reconstructed data and lower in zero-filled data. Furthermore, denoising of these accelerated datasets led to image blurring, which was also most robust in homodyne-reconstructed images and lowest in images that were reconstructed with zero-filling.
Obtaining images with partial Fourier 1.2 led to less residual noise and normal image appearance when denoised with 70%. Denoising was ineffective, however, when combining a partial Fourier with interpolation (1.35 in Read and Phase) with the source and the denoised image having similar appearance.
Grappa acceleration led to noisier images than in acquisition with partial Fourier. Reconstructing the obtained data with the denoising algorithm removed noise from the GRAPPA image obtained with an acceleration factor 2.
However, the noise is not fully removed in the image obtained with an acceleration factor 3. Furthermore, reconstruction artifacts and loss of tissue contrast unrelated to the denoising reconstruction are visible.
This demonstrates that the algorithm may be unable to work with data that has a noise characteristic different from the noise that the networks have been trained with (i.e., without acceleration and interpolation). Yet, the outcome is dependent on the selected acquisition and reconstruction parameters.
Denoising may enhance images where SNR is reduced by applying more rapid imaging protocols. Overall decreases in acquisition time that are achievable by adapting imaging protocols may significantly reduce exposure time for animals in the tool and can therefore be utilized for refining the method. It also makes it possible to obtain extra read-outs in an MRI examination or attain higher efficiency for research purposes.
Boosting the resolution of images per unit time
High-resolution MRI produces detailed structures in tissue and organs and can help detect abnormalities such as lesions or tumors. However, high-resolution structural MRI scans necessitate long image acquisition times to overcome the inherently low SNR. Bruker demonstrates how Smart Noise Reduction can shorten acquisition times while preserving image quality.
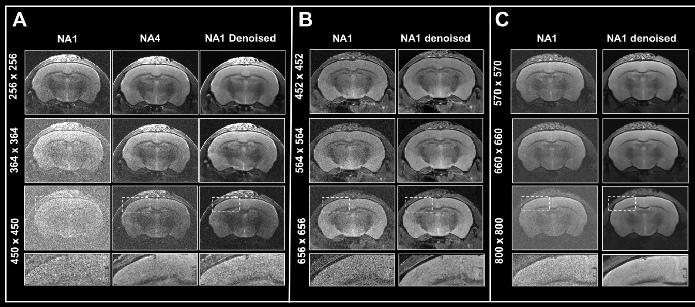
Figure 6. Boosting resolution. Ex vivo T2-weighted TurboRARE data of a fixed mouse head acquired at A) 3 Tesla, B) 7 Tesla, and C) 9.4 Tesla. All images were acquired with 0.8 mm (A) and 0.7 mm (B, C) slice thickness and with a field-of-view of 20 x 20 mm2 and the given matrix size using either no averaging or acquiring 4 averages. Images were reconstructed with no denoising (NA1 and NA4), or after denoising (NA1 Denoised) using a network Large, applying a pre-denoising level of 50% and denoising level of 70%. Image Credit: Bruker BioSpin Group
In Fig. 6, axial T2-weighted TurboRARE images of a fixed mouse head obtained at various field strengths are contrasted. Images were obtained via a fixed field-of-view of 20 x 20 mm2, with 0.8 mm (3 Tesla) and 0.7 mm (7 and 9.4 Tesla) thick slices and with diverse matrix sizes to generate images with various spatial resolutions.
Of particular note, the matrix sizes were made larger by up to a factor of 1.8, 2.6, and 3.1 (vs a matrix size of 256 of the reference protocols) for images obtained at 3, 7, and 9.4 Tesla, respectively. These resolution increases lead to a concomitant loss in SNR for each image. Loss in SNR can be made up for by utilizing averaging and thus additional data was obtained with four averages.
Comparing non-denoised averaged images with single averaged images showed that denoising reduces increased image noise at elevated resolutions and results in images of similar quality to those obtained through averaging.
Improvements in image quality by denoising are more significant with data obtained at 3 Tesla, where heightening the resolution generates images that are more difficult to understand, compared to data obtained at 7 and 9.4 Tesla, where SNR is innately higher.
In any case, images obtained at 7 and 9.4 Tesla are significantly helped by denoising during reconstruction, as the intrinsically elevated SNR of these images can be used for choosing smaller voxel dimensions. Thus, denoising enables researchers to choose higher resolutions within a given unit of time, stemming from a reduced need for averaging. This can also be practical when averaging might be undesirable or impractical.
Conclusion
Smart Noise Reduction efficiently removes noise from structural images, improving image quality. With denoising levels and network choices, users can maximize denoising results according to their needs.
Noisy images can be improved when SNR is limited, e.g., images attained at low field strengths, when optimal coils are unavailable, or when averaging is impractical or desired. When SNR is sufficient, denoising can be utilized to increase resolution per unit of time or selected to facilitate acquisition speed.
References and further reading
- Aja-Fernández, S., Vegas-Sánchez-Ferrero, G. and Tristán-Vega, A. (2013). Noise estimation in parallel MRI: GRAPPA and SENSE, Magnetic Resonance Imaging, 32(3), pp. 281–290. https://doi.org/10.1016/j.mri.2013.12.001.
- Griswold, M.A. et al. (2002). Generalized autocalibrating partially parallel acquisitions (GRAPPA), Magnetic Resonance in Medicine, 47(6), pp. 1202–1210. https://doi.org/10.1002/mrm.10171.
- Huang, H. et al. (2004). Analysis of noise effects on DTI‐based tractography using the brute‐force and multi‐ROI approach, Magnetic Resonance in Medicine, 52(3), pp. 559–565. https://doi.org/10.1002/mrm.20147.
- Macovski, A. (1996). Noise in MRI, Magnetic Resonance in Medicine, 36(3), pp. 494–497. https://doi.org/10.1002/mrm.1910360327.
- Mishro, P.K. et al. (2021). A survey on State-of-the-Art Denoising Techniques for brain magnetic resonance images, IEEE Reviews in Biomedical Engineering, 15, pp. 184–199. https://doi.org/10.1109/rbme.2021.3055556.
- Pruessmann KP;Weiger M;Scheidegger MB;Boesiger P (2012). SENSE: sensitivity encoding for fast MRI. Magnetic resonance in medicine, [online] 42(5). Available at: https://pubmed.ncbi.nlm.nih.gov/10542355/.
About Bruker BioSpin Group
The Bruker BioSpin Group designs, manufactures, and distributes advanced scientific instruments based on magnetic resonance and preclinical imaging technologies. These include our industry-leading NMR and EPR spectrometers, as well as imaging systems utilizing MRI, PET, SPECT, CT, Optical and MPI modalities. The Group also offers integrated software solutions and automation tools to support digital transformation across research and quality control environments.
Bruker BioSpin’s customers in academic, government, industrial, and pharmaceutical sectors rely on these technologies to gain detailed insights into molecular structure, dynamics, and interactions. Our solutions play a key role in structural biology, drug discovery, disease research, metabolomics, and advanced materials analysis. Recent investments in lab automation, optical imaging, and contract research services further strengthen our ability to support evolving customer needs and enable scientific innovation.
Sponsored Content Policy: News-Medical.net publishes articles and related content that may be derived from sources where we have existing commercial relationships, provided such content adds value to the core editorial ethos of News-Medical.Net which is to educate and inform site visitors interested in medical research, science, medical devices and treatments.