Multi-dimensional nuclear magnetic resonance (NMR) spectroscopy is a vital device for structure elucidation and verification, molecular dynamics, and structural analyses, among other uses.1,2
An initial step of most NMR studies is identifying peaks in the obtained spectrum. Producing a peak list is especially crucial if the spectrum is automatically prepared.
Peak picking is still performed manually. In 1D spectroscopy, the challenge is acquiring a meaningful peak list by separating overlapping peaks. In multi-dimensional spectroscopy, the primary challenge is differentiating between real NMR signals and artifacts produced due to acquisition time limitations and pulse sequence imperfections.
This process can be laborious depending on the measured sample and type of experiment conducted. High-throughput and routine experiments especially can significantly benefit from an automated peak-picking process.
Numerous algorithms have been established to automate peak picking.3-9 These are normally developed for specific types of spectra, like the DEEP picker neural network model by Li et al. optimized for protein spectra, which does not generalize perfectly on different forms of experiments.9
Broader approaches like the 2D peak picker presently applied in TopSpin (TopSpin command: pp2d)10 function through intensity thresholding. These algorithms cannot differentiate between artifacts and real NMR signals if their amplitudes are the same magnitude.
This article establishes a neural network-based technique for automatic peak picking in 2D NMR spectroscopy, demonstrating a better-performing algorithm than earlier approaches in TopSpin and constructing a comprehensive peak list while preventing picking artifacts.
The new TopSpin command pp2dml introduces the first AI-based tool for processing multi-dimensional NMR spectra to the existing commands “sigreg,” “apbk,” and “mldcon".11-13
Methods
As 2D spectra are scarcer than their 1D equivalents and comprise many more data points, using fully deep learning-based techniques is computationally costly. The method presented here should deliver a peak list within seconds.
This technique is structured in three steps for computational efficiency:
- Identification of possible peak candidates.
- Approximately 30 features from each candidate, e.g. the signal-to-noise ratio of the peak or intensity patterns in regions related to the peak, are obtained from the spectrum and fed into a neural network to differentiate between real NMR peaks and artifacts, including T1-noise peaks or truncation artifacts.
- Real NMR peaks are noted as peaks from the compound, impurity, solvent, or special artifacts (e.g., HMQC sidebands).
A dedicated neural network was created for COSY, HMBC, and HSQC spectra to guarantee optimum detection of real NMR peaks for 2D experiments. For training, 5000 synthetic spectra were used.
Experimental data is only accessible in restricted amounts and must be manually annotated, which can establish peak list discrepancies.
Synthetic data is accessible in vast amounts and the peak list is accurately understood. The synthetic spectra are customized to include numerous sizes, zero-filling ratios, and artifacts applicable to the specific experiment.
The neural networks produced for the various studies include several fully combined layers with approximately 800 k weights.
Real NMR signals established by the network are categorized into compound, impurity, solvent, and other artifacts via a rule-based technique. Compound peaks are differentiated from impurities peaks by an amplitude threshold for the spectrum’s most intense peak.
Experimental artifacts, including the professed COSY artifacts in HSQC spectra, are detected by looking for patterns in the peak list. The crossroads between the 1H and 13C frequencies of two real NMR signals are analyzed for weaker signals to locate COSY artifacts.
Solvent peaks are discovered by exploring a pre-defined list of recognized solvent signals. The full list of peak types is provided in the TopSpin manual entry “pp2dml.”10 TopSpin presents the peak types as peak annotations and can be employed to filter out unwanted peaks (e.g., eliminate all impurities and artifacts).
An experimental dataset containing 11 COSY, 24 HSQC, and 16 HMBC spectra with manually created peak lists was employed to determine how well the method can differentiate between real NMR peaks and artifacts.
A total of 100 synthetic spectra with accurately recognized peak positions were utilized for each experiment. Recognized peak positions (ground truth) were compared with the peaks selected by Bruker’s algorithm using a tolerance threshold to match peaks with slightly different chemical shifts and calculate the algorithm results.
True positives, false negatives, and false positives were differentiated:
- True positives are peaks observed in the ground truth peak list and by the algorithm (expected peaks).
- False negatives are peaks in the ground truth peak list but not discovered by the algorithm (missing peaks).
- False positives are peaks found by the algorithm but not present in the ground truth peak list (over-picked peaks).
Two separate metrics were distinguished to quantitatively measure the performance of this peak-picking algorithm.
Metric 1 (sensitivity) measures how often ground truth peaks are discovered contrasted with the number of peaks in the ground truth peak list:

Metric 2 reveals the amount the algorithm over-picks, evaluating wrongly picked peaks alongside the total number of picked peaks:

Both metric values are between 0–1 and a higher value signifies a superior result.
Results and discussion
Figure 1 illustrates the results of “pp2dml” in an area of a COSY spectrum. The peaks are demonstrated together with the peak annotations exposed by the algorithm. The two main diagonal doublets at F1 = F2 = 6.2 ppm and F1 = F2 = 6.7 ppm generate four cross-peaks (two off-diagonal doublets).
Their satellites also create four diagonal and eight off-diagonal doublets caused by scalar couplings. A low-intensity peak caused by sample impurity is determined near each of the four primary peaks.
This spectral region is a great test for Bruker’s algorithm thanks to truncation artifacts in the F1 direction and T1 noise at the frequencies of the major doublets whose intensity is greater than the satellite peaks.
It becomes critical here to choose the low-intensity satellite and impurity peaks while preventing the selection of noise. Only real peaks were chosen here, demonstrating “pp2dml”’s high performance.
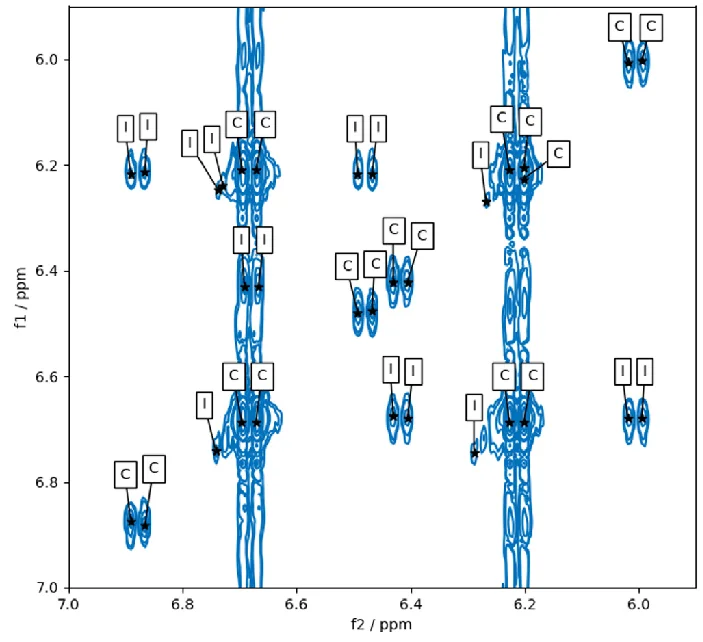
Figure 1. Results of pp2dml on the aromatic region in the COSY spectrum of Santonin. Contour lines are shown in blue and picked peaks as black stars. Peak annotations found by the algorithm are given in boxes (C=compound, I=impurity). Image Credit: Bruker BioSpin Group
Figure 2 demonstrates the equivalent section of the spectrum as in Figure 1 but with the peaks found by the existing TopSpin command “pp2d.” There are no annotations as the “pp2d” command does not differentiate between compound and other peaks.
The intensity thresholds for peak acceptance must be input manually for “pp2d.” If a high threshold value is selected to prevent truncation artifacts and T1 noise, only the major doublets are chosen (Figure 2: Red stars).
This setting overlooks the satellite and impurity peaks in the spectrum, but if the threshold is set low enough to select the satellites and their cross-peaks, many truncation artifacts and T1 noise peaks are chosen alongside the preferred ones (Figure 2: Black with red stars).
Most of the picked peaks here are not real NMR peaks, and the low-intensity impurity peaks, which could still be wanted depending on the application, are still overlooked by the user. Outside of the threshold setting, “pp2d” does not achieve the performance of “pp2dml” for this case.
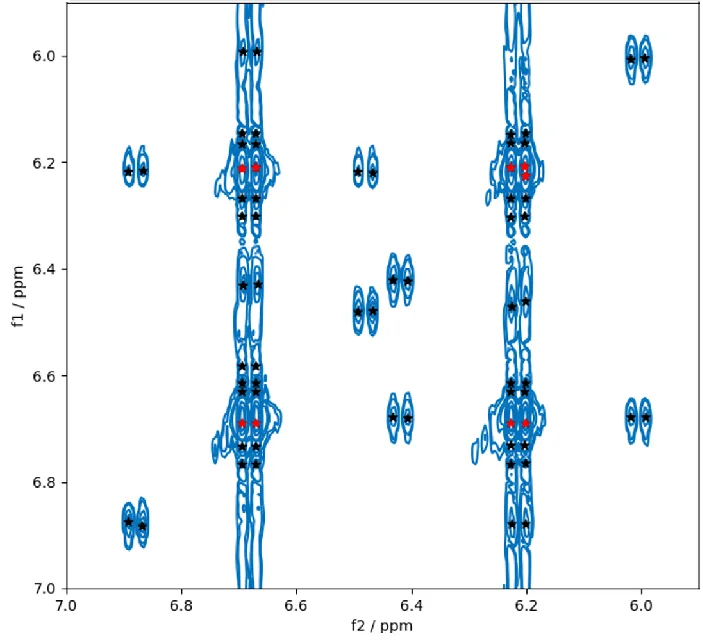
Figure 2. Peaks found by the existing TopSpin command pp2d on the same region as shown in Figure 1. Two different peak-lists are shown: One for a high value of the threshold (red stars) and one for a low value of the threshold (black stars). Image Credit: Bruker BioSpin Group
“pp2dml”’s performance on the experimental and synthetic datasets is illustrated in Figure 3, divided by experiment type (HMBC, HSQC, and COSY). It highlights the fraction of ground truth peaks discovered (metric m1) and a measure of over-picking (metric m2).
m1 and m2 are mainly close to one in the synthetic dataset, suggesting a large fraction of peaks discovered with little over-picking. COSY spectra is an exception, where m1 is less because some weak signals are overlooked.
The weak signals come from the numerous patterns in both dimensions in COSY but not other experiment types. The high values verify that the network training worked and that the characteristics of the synthetic NMR spectra could be taught.
m1 values are almost one for the experimental dataset, while m2 values are lower. The algorithm was tuned to score higher on m1 than m2 as it is assumed that missing a peak is worse than over-picking.
Some experimental HSQC spectra have only a few peaks and a single over-picked peak can significantly decrease the metric value. A warning here is that the ground truth peaks were accurately chosen manually, but some lingering residual errors in the peak list can still impact the metrics.
A precise definition of whether a peak should be considered a real NMR peak is abstract and must be discussed. It may also rely on the reason the peak list is employed.
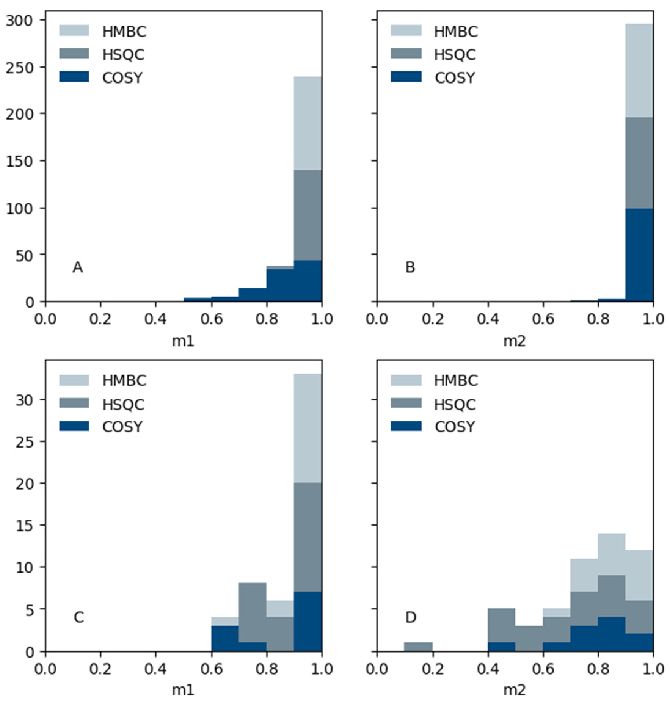
Figure 3. Distribution of the metric m1 (fraction of ground truth peaks found) and metric m2 (indication of over-picking) of pp2dml results on the synthetic dataset (upper panels A and B) and the experimental dataset (lower panels C and D) vs the number of spectra. Image Credit: Bruker BioSpin Group
“pp2dml” and “pp2d” were compared for the experimental dataset (Figure 4) utilizing a diagram like a receiver operating characteristic curve. For the figure, the metric averaged over all HSQC, HMBC, and COSY spectra, or the whole dataset is determined for “pp2dml” and “pp2d.”
As “pp2dml” is fully automated and does not necessitate operator input, its result is a single combination of average m1 and m2 values. For “pp2d,” a minimum intensity threshold (parameter name in TopSpin: MI) must be input per spectrum, causing different m1 and m2 dependent on this threshold value. “pp2d” is therefore shown as a curve in the diagram, dependent on the threshold value.
Minimum over-picking arises if the intensity threshold is selected high, but weak peaks are overlooked, causing a low value of m1 but a high value of m2.
The intensity threshold of “pp2d” for Figure 4 is outlined as either a fraction of the highest peak of a spectrum (i.e., between 0.05–10 % maximum intensity) or a multiple of the noise level of the spectrum (i.e., between 0.8–16 times the noise level).
An ideal peak picker would be at the top left corner of each panel in Figure 4, with m1 and m2 equal to 1. The “pp2dml” values are nearer to this corner and separate from the threshold value selection, indicating that the performance of “pp2dml” is better than that of “pp2d.”
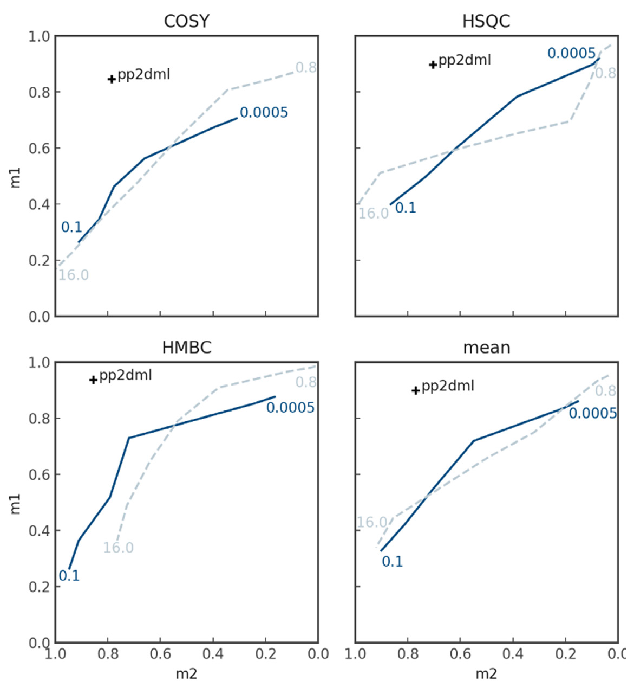
Figure 4. Metric values of pp2dml (black cross) compared to pp2d (blue lines) averaged over all COSY, HSQC and HMBC spectra or the entire dataset (mean). For pp2d MI has been varied per spectrum as a fraction of the maximum amplitude of the spectrum (solid line) or a multiple of the noise level (dashed line). Image Credit: Bruker BioSpin Group
Options to run “pp2dml”
The innovative technique can be run fully automated without requiring parameter selection. Optional parameters can be set to customize the results to a particular use. The TopSpin manual entry of “pp2dml”10 provides a full list of the run parameters.
Figure 5 highlights an area of a COSY spectrum that appears asymmetric because of axial artifacts. The off-diagonal peaks at the bottom right of the spectrum are not selected in the default settings as they do not have a symmetry partner and no parallel diagonal peak.
If “pp2dml” is initiated with the option “-nosymmetryfilter”, those peaks are selected. This option is beneficial if weak peaks in COSY spectra must be identified near the detection threshold.
Some uses necessitate only compound peaks for evaluation. To remove all peaks not marked as compounds, like impurities or solvent peaks, the option “-onlycompound” can be input. The option “-shoulder” is available to uncover peaks not at a local minimum or maximum.
External projection data can be used to searate peaks with no equivalent in the 1D spectrum. This filter is initiated with the option “-use projection” and internally runs the AI command “mldcon” on the 1D spectrum to uncover potential peak positions.
Table 1 demonstrates the metric values for the experimental COSY spectra when either the option “-nosymmetryfilter” or “-onlycompound” is input. As presumed, the option “-nosymmetryfilter” increases the fraction of peaks identified (m1 increases) but sacrifices a larger fraction of over-picked peaks (m2 lower).
The option “-onlycompound” acts differently, raising the metric for over-picking and reducing the detection fraction.
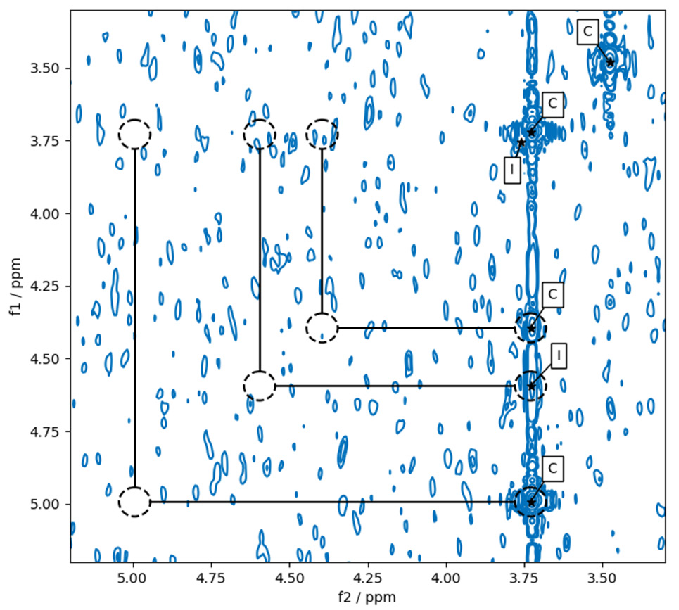
Figure 5. Results of pp2dml run with the option “-nosymmetryfilter” on a COSY spectrum. With that option set, peaks are picked despite a missing symmetry partner and no corresponding diagonal peak present. Dashed circles show the peaks only picked with the option “-nosymmetryfilter” set and positions checked by the symmetry-filter. Image Credit: Bruker BioSpin Group
Table 1. Metric results of pp2dml on the experimental COSY spectra. Source: Bruker BioSpin Group
| Settings for pp2dml |
m1 |
m2 |
| No option set (default) |
0.85 |
0.79 |
| Symmetry filter disabled (“-nosymmetryfilter”) |
0.92 |
0.67 |
| Only compound peaks (“-onlycompound”) |
0.67 |
0.85 |
Running pp2dml on Fourier 80 spectra
Table 2 demonstrates “pp2dml” results obtained with the benchtop tool Bruker Fourier 80 alongside those measured at elevated field strengths. For HSQC and HMBC spectra, “pp2dml” functioned similarly for low- and high-field spectra, highlighting the capacity to employ this technique for lower-field spectra.
For COSY spectra, “pp2dml” indicates a lower detection fraction m1 in Fourier 80 spectra than higher fields, primarily resulting from a lower signal-to-noise ratio in spectra calculated with the Fourier 80 spectrometer in the test set.
The symmetry filter frequently eliminates peaks thanks to a missing symmetry partner. As previously mentioned, m1 can be enhanced utilizing the “-nosymmetryfilter” option, but this causes some over-picking.
Table 2. Metric results of pp2dml on Fourier 80 spectra compared to higher field strength (Proton base frequency > 300 MHz). Source: Bruker BioSpin Group
| Settings for pp2dml |
m1 |
m2 |
| COSY (n=11) |
| All spectra |
0.85 |
0.79 |
| Higher-field spectra (n=8) |
0.91 |
0.75 |
| Fourier 80 Spectra (n=3) |
0.67 |
0.89 |
| HSQC (n=24) |
| All spectra |
0.90 |
0.70 |
| Higher-field spectra (n=20) |
0.90 |
0.71 |
| Fourier 80 Spectra (n=4) |
0.91 |
0.68 |
| HMBC (n=16) |
| All spectra |
0.94 |
0.85 |
| Higher-field spectra (n=12) |
0.92 |
0.84 |
| Fourier 80 Spectra (n=4) |
0.97 |
0.90 |
Peak annotation
Some tests produce real NMR peaks, often not employed to interpret the spectrum. HSQC spectra exhibit weak peaks caused by multiple bond correlations between a proton and carbon.
These 3J long-range coupling effects are named COSY artifacts and are frequently unneeded for interpreting the spectrum. Peak annotations can only be taken for COSY, HMBC, and HSQC spectra.
Figure 6 demonstrates an area of an HSQC spectrum with peaks and peak annotations uncovered by “pp2dml.” The peaks at the top right and bottom left are interpreted as compound peaks.
The two low-intensity peaks at the top left and bottom right are interpreted as COSY artifacts, originating from the two compound peaks and categorized by their symmetric organization.
“pp2dml” was run on an HMBC spectrum in Figure 7. The two peaks at the bottom of the area are accurately marked as compound peaks. The two peaks at the top are accurately marked as 1J coupling artifacts (or HMQC responses).
Their nearly equal F1 positions categorize them at a given f2 distance and are symmetrically organized in F2 around a compound peak that can occupy any F1 position.
Conclusion
A fully automated algorithm that can operate without user input has been presented to pick peaks in 2D NMR spectra. The method applies a rule-based algorithm, utilizing neural networks to select the peaks before categorizing them into compound peaks and different artifacts. The equivalent command “pp2dml” is accessible in TopSpin version 4.4.1 and higher.
The results indicate that “pp2dml” operates better than the TopSpin command “pp2d.” The most crucial difference is that, unlike the rule-based pp2d algorithm, the neural network in “pp2dml” learned to differentiate real NMR peaks from artifacts.
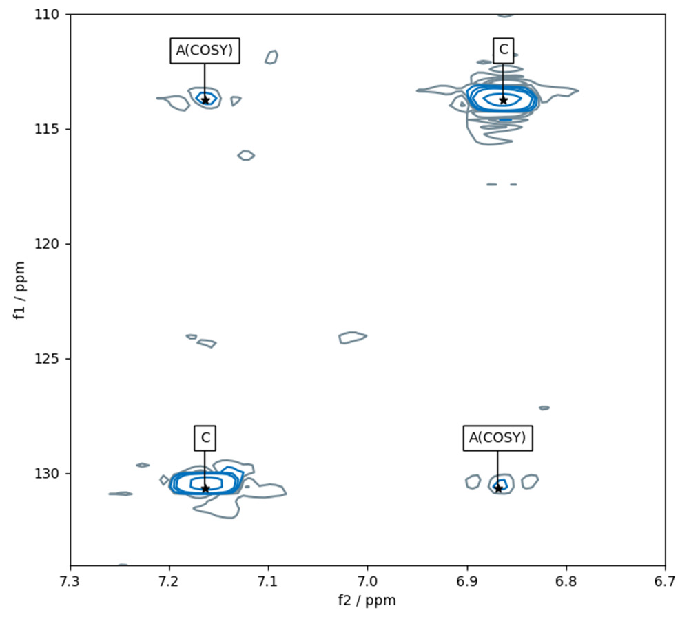
Figure 6. Result of pp2dml on a region of a HSQC spectrum. Contour lines are shown in blue and grey for positive and negative amplitudes, respectively). The peak annotation “C” stands for compound and “A(COSY)” for a COSY artifact. Image Credit: Bruker BioSpin Group
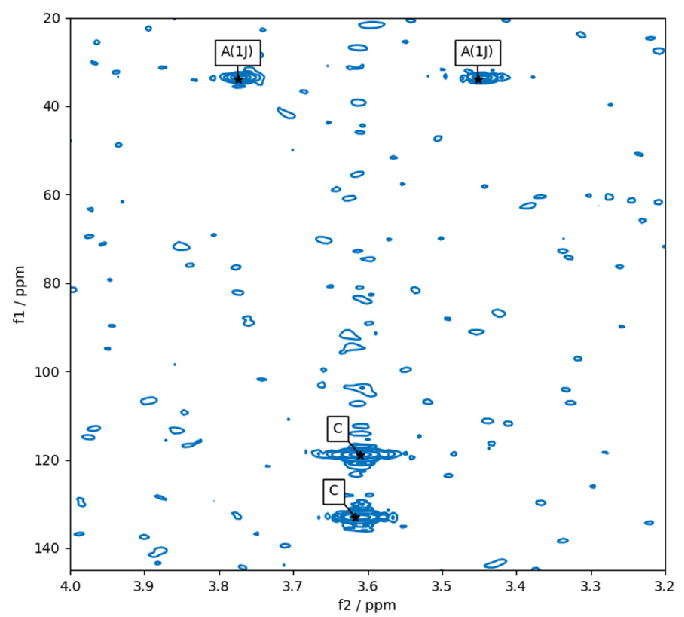
Figure 7. Result of pp2dml on a region of a HMBC spectrum. The peak annotation “C” stands for compound and “A(1J)” for an artifact due to 1J coupling. Image Credit: Bruker BioSpin Group
Practical tips
- The algorithm is augmented for COSY, HSQC, and HMBC spectra and will not operate on other types of spectra. The option “-f” can be utilized (“pp2dml -f”) to force the algorithm to operate on other types of 2D experiments but sufficient results cannot be promised for other spectra. Future updates aim to include more spectrum types.
- Peak annotations are available only for COSY, HSQC, or HMBC spectra.
- While “pp2dml” works with non-uniform sampling spectra, it is not optimized to detect low-SINO peaks in such spectra.
- For spectra with external projections, use the “pp2dml -useprojections” command to pick peaks only in regions with signals in the 1D projections.
- To reduce over-picking, there are two options: “pp2dml -ppmpnum=X” to pick only the X most intense peaks and “pp2dml -onlycompound” to display only the peaks classified as compounds.
- If peaks are missing in a COSY spectrum, the “pp2dml -nosymmetryfilter” command can be utilized, which adds the peaks to the peak list even if they have no symmetric or diagonal equivalent.
- Utilize the command “help pp2dml” in the TopSpin manual to access the “pp2dml” page.
References
- Alipanahi, B., et al. (2009). PICKY: a novel SVD-based NMR spectra peak picking method. Bioinformatics, 25(12), pp.i268–i275. https://doi.org/10.1093/bioinformatics/btp225.
- Bruderer, S., Paruzzo, F., and Bolliger, C. (2021). Deep learning-based phase and baseline correction of 1D 1H NMR spectra. Bruker. Available at: https://www.bruker.com/en/products-and-solutions/mr/nmr-software/topspin.html.
- Cheng, Y., Gao, X. and Liang, F. (2013). Bayesian peak picking for NMR spectra. Genomics Proteomics & Bioinformatics, 12(1), pp. 39–47. https://doi.org/10.1016/j.gpb.2013.07.003.
- Ernst, R.R., Bodenhausen, G. and Wokaun, A. (1990). Principles of Nuclear Magnetic Resonance in One and Two Dimensions. Oxford University Press eBooks. https://doi.org/10.1093/oso/9780198556473.001.0001.
- Kobayashi, N., et al. (2018). Noise peak filtering in multi-dimensional NMR spectra using convolutional neural networks. Bioinformatics, [online] 34(24), pp.4300–4301. https://doi.org/10.1093/bioinformatics/bty581.
- Klukowski, P. et al. (2018). NMRNet: a deep learning approach to automated peak picking of protein NMR spectra. Bioinformatics, 34(15), pp. 2590–2597. https://doi.org/10.1093/bioinformatics/bty134.
- Koradi, R. et al. (1998). Automated peak picking and peak integration in macromolecular NMR spectra using AUTOPSY. Journal of Magnetic Resonance, 135(2), pp. 288–297. https://doi.org/10.1006/jmre.1998.1570.
- Li, D.-W. et al. (2021). DEEP picker is a deep neural network for accurate deconvolution of complex two-dimensional NMR spectra. Nature Communications, 12(1). https://doi.org/10.1038/s41467-021-25496-5.
- Liu, Z. et al. (2012). WaVPeak: picking NMR peaks through wavelet-based smoothing and volume-based filtering. Bioinformatics, 28(7), pp. 914–920. https://doi.org/10.1093/bioinformatics/bts078.
- Paruzzo, F. et al. (2020). Automatic Signal region detection in 1 h NMR spectra using deep learning. https://www.semanticscholar.org/paper/Automatic-Signal-Region-Detection-in-1-H-NMR-Using-Paruzzo-Bruderer/f7edc6d46a8a3969940087e0045eb5c86c0ac60e.
- Schmid, N., et al. (2023). Deconvolution of 1D NMR spectra: A deep learning-based approach. Journal of Magnetic Resonance, 347, pp.107357–107357. https://doi.org/10.1016/j.jmr.2022.107357.
- TopSpin Processing Commands and Parameters User Manual Innovation with Integrity. NMR. Available at: https://nmr.chem.ucsb.edu/docs/Bruker_NMR_Manuals/processing-reference_v007.pdf (Accessed 14 Dec. 2024).
- van de Ven, F.J.M., (1996). Multidimensional NMR in Liquids: Basic Principles and Experimental Methods. Wiley. Available at: https://www.wiley.com/en-us/Multidimensional+NMR+in+Liquids%3A+Basic+Principles+and+Experimental+Methods-p-9780471185949.
About Bruker BioSpin Group
The Bruker BioSpin Group designs, manufactures, and distributes advanced scientific instruments based on magnetic resonance and preclinical imaging technologies. These include our industry-leading NMR and EPR spectrometers, as well as imaging systems utilizing MRI, PET, SPECT, CT, Optical and MPI modalities. The Group also offers integrated software solutions and automation tools to support digital transformation across research and quality control environments.
Bruker BioSpin’s customers in academic, government, industrial, and pharmaceutical sectors rely on these technologies to gain detailed insights into molecular structure, dynamics, and interactions. Our solutions play a key role in structural biology, drug discovery, disease research, metabolomics, and advanced materials analysis. Recent investments in lab automation, optical imaging, and contract research services further strengthen our ability to support evolving customer needs and enable scientific innovation.
Sponsored Content Policy: News-Medical.net publishes articles and related content that may be derived from sources where we have existing commercial relationships, provided such content adds value to the core editorial ethos of News-Medical.Net which is to educate and inform site visitors interested in medical research, science, medical devices and treatments.