Single cells are essential for the generation of biologics, which is a fundamental requirement in biopharmaceutical research and development. The International Council for Harmonization of Technical Requirements for Pharmaceuticals for Human Use (ICH) has mandated that biotherapeutics must come from a single clonal source to guarantee consistency and quality and to minimize population heterogeneity.
The Cyto-Mine® Single Cell Analysis System was developed with the primary purpose of ensuring monoclonality through accurate and reliable single-cell dispensing.
The seamlessly integrated Cyto-Mine® system automates cell isolation, productivity monitoring, sorting, imaging, and dispensing into one process, shortening turnaround times, enhancing screening potential, and guaranteeing monoclonality (Figure 1).
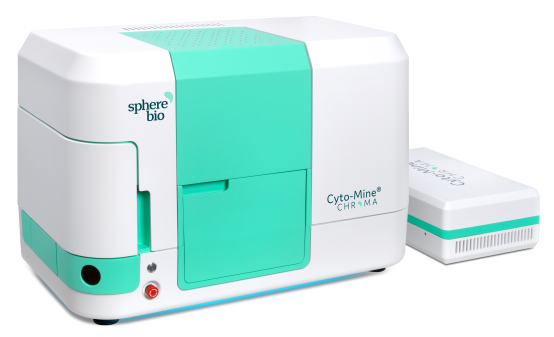
Figure 1. The Cyto-Mine® Single Cell Analysis System. Image Credit: Fluidic Sciences and Sphere Bio
One of the main features of Cyto-Mine® is dispensing. Reliable and efficient dispensing is a critical performance criterion to ensure the feasibility of Cyto-Mine® as a tool for cloning cells.
A series of studies were carried out to prove that the images obtained of the encapsulated cells before dispensing coincided with the number of cells distributed into each well. This was done to verify the fidelity and reliability of the cell dispensing of Cyto-Mine®.
Aims and objectives
- This study examined the fidelity and reliability of cell dispensing by Cyto-Mine®
- For testing precision, both fluorescent beads and cells were examined
- The study found that Cyto-Mine® offers a reliable, high-throughput technology for selective single-cell cloning
Methods and results
Cyto-Mine® workflow
Utilizing picodroplet technology, Cyto-Mine® encapsulates individual cells with assay reagents in a picodroplet, which is then incubated at 37 °C to allow for cell secretion and the development of a productivity assay.
A pair of fluorescently-labeled affinity probes (such as antibodies) were used in the productivity assay; when they attach to the target IgG molecule, they produce a fluorescent signal that is detected by Cyto-Mine®.
Cyto-Mine® can then sort each picodroplet based on the assay results and dispense the ‘hit’ cells into multi-well microtiter plates. Each picodroplet is given clonality confirmation five times before the Cyto-Mine® images are distributed (Figures 2 and 3).
The study outlined in this article investigates the relationship between the cells shown in the below images and the cells present on the dispensed microtiter plate.
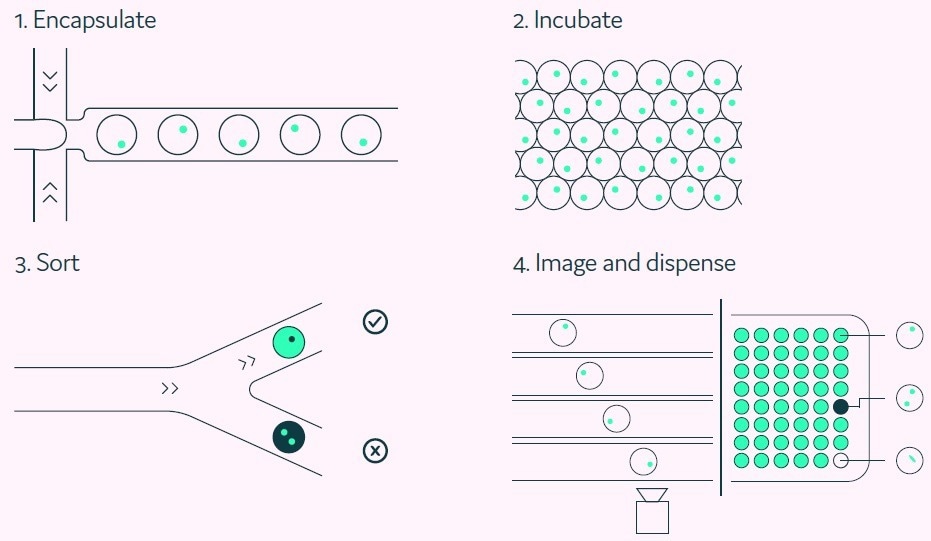
Figure 2. A Cyto-Mine® workflow. Integration of single cell screening, sorting, isolation, and verification using a fully integrated microfluidic process. Image Credit: Fluidic Sciences and Sphere Bio
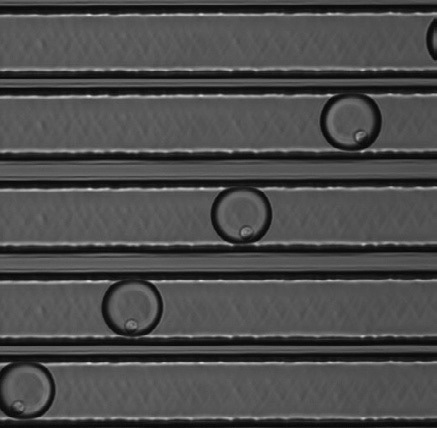
Figure 3. Assurance of monoclonality. Cyto-Mine® provides five sequential images of each picodroplet before dispensing. As the picodroplet travels through the microfluidic channels it rotates changing the position and optical view of the cell inside it. Image Credit: Fluidic Sciences and Sphere Bio
Assessing dispensing fidelity
This study looked at the efficacy of dispersing fluorescent beads along with cells. To eliminate biological variability and reduce user-related errors, the preliminary research used fluorescent beads. This was followed by a study of an IgG-secreting CHO cell line (provided by FUJIFILM Diosynth Biotechnologies, UK).
To assess the accuracy of Cyto-Mine® dispensing, the number of beads or cells in each dispensed picodroplet was manually counted from their images taken by Cyto-Mine® prior to dispensing (Cntdrop) and from the associated wells (Cntwell) (Figure 4).
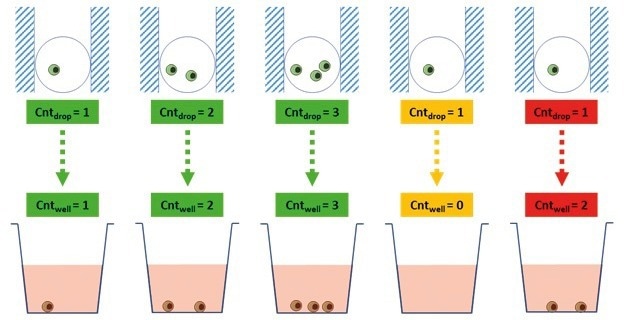
Figure 4. Principle of Cyto-Mine® Dispensing Fidelity Test. This image shows the different potential outcomes of the dispensing fidelity test for each picodroplet dispensed. Green wells represent accurate dispensing, i.e. correlation of the image and the well count; yellow represents a discrepancy where the number of cells in the well is lower than in the cells counted in the image; and lastly, red represents a discrepancy where the number of cells in the well is higher than the cells counted in the image. Image Credit: Fluidic Sciences and Sphere Bio
Analysis of fluorescent beads
Eleven different studies were run over a five-week period to evaluate the reliability of fluorescent beads’ dispensing. To increase the variety of fluorescent bead occupancy in picodroplets and wells and facilitate the ability to detect any differences in bead counts between the picodroplet and the well, a high input concentration (3 × 10⁶/mL) was employed.
Figure 5 displays a sample data set that was collected after fluorescent beads were dispensed into a 96-well microtiter plate. The bead count in the associated well is indicated at the bottom of each square, and the bead count in the corresponding picodroplet is indicated at the top of each square.
With an average accuracy of 99.3%, Cyto-Mine® distributed the same number of beads as was imaged (Table 1).
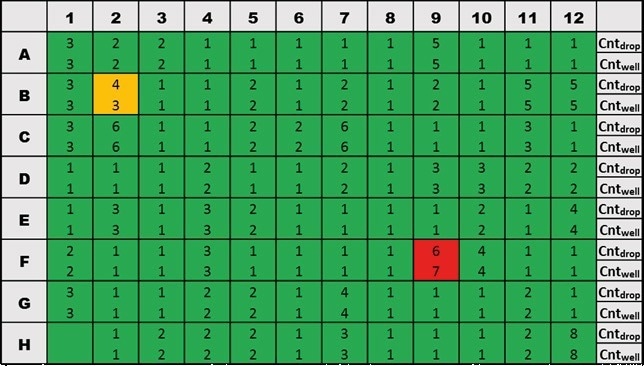
Figure 5. Example data for one 96-well microtiter plate dispensed with 20 µm fluorescent beads. Image Credit: Fluidic Sciences and Sphere Bio
Table 1. Dispensing Accuracy of Beads. This table shows the number of wells where the beads counted in each well either corresponded, were fewer than, or were more than the image reported by Cyto-Mine®. Fluorescent beads were dispensed into 10,560 wells (110 96-well microtiter plates). In each of the eleven experiments, ten 96-well microtiter plates were dispensed (960 wells were processed per experiment). Source: Fluidic Sciences and Sphere Bio
| Experiment number |
Beads counted corresponded with image
(Cntwell = Cntdrop) |
Fewer beads
(Cntwell < Cntdrop) |
More beads
(Cntwell > Cntdrop) |
| 1 |
940 |
10 |
10 |
| 2 |
960 |
0 |
0 |
| 3 |
957 |
3 |
0 |
| 4 |
950 |
7 |
3 |
| 5 |
958 |
0 |
2 |
| 6 |
953 |
0 |
7 |
| 7 |
959 |
1 |
0 |
| 8 |
960 |
0 |
0 |
| 9 |
943 |
7 |
10 |
| 10 |
951 |
2 |
7 |
| 11 |
960 |
0 |
0 |
| Total |
10,491 |
30 |
39 |
| Percentage dispensing accuracy |
99.34% |
0.28% |
0.36% |
| CV (%) of dispensing accuracy |
0.7% |
/ |
/ |
Table 2. Dispensing Accuracy of Cells. This table shows the number of wells where the cells counted in each well either corresponded, were less than, or were more than the image reported by Cyto-Mine®. CHO cells were dispensed into 1,373 wells (fourteen 96-well microtiter plates, some wells were used as controls and some wells were not able to be counted). In each of the five experiments two or three 96-well microtiter plates were dispensed. Source: Fluidic Sciences and Sphere Bio
| Experiment number |
Cells counted corresponded with image
(Cntwell = Cntdrop) |
Fewer cells
(Cntwell < Cntdrop) |
More cells
(Cntwell > Cntdrop) |
| 1 |
266 |
5 |
0 |
| 2 |
282 |
2 |
1 |
| 3 |
285 |
0 |
0 |
| 4 |
186 |
3 |
1 |
| 5 |
281 |
2 |
0 |
| Total # wells |
1300 |
12 |
2 |
| Percentage dispensing accuracy |
98.9% |
0.91% |
0.15% |
| CV (%) of dispensing accuracy |
1.3% |
/ |
/ |

 Download the full paper
About Fluidic Sciences and Sphere Bio
Fluidic Sciences develops transformative in‑solution technologies for protein interaction analysis. Its flagship Fluidity One‑M instrument leverages Microfluidic Diffusional Sizing (MDS) to measure binding affinity, stoichiometry, size, and concentration without immobilization - directly in complex backgrounds such as serum, plasma, and lysate.
Sphere Bio is a brand of Fluidic Sciences. Its technology develops and manufactures single‑cell analysis and monoclonality assurance systems that enable researchers to find, analyze, and isolate the most valuable cells with speed and precision. Its proprietary picodroplet microfluidics and Cyto‑Mine® Chroma multiplexing platform power applications across antibody discovery, cell line development, cell engineering, and cell therapy.
Sponsored Content Policy: News-Medical.net publishes articles and related content that may be derived from sources where we have existing commercial relationships, provided such content adds value to the core editorial ethos of News-Medical.Net which is to educate and inform site visitors interested in medical research, science, medical devices and treatments.