Coronary flow reserve (CFR) is a key sign of coronary artery disease, namely how the coronary arteries that feed blood to the heart may adapt to various physiological situations such as exercise, aging, and normal stress.
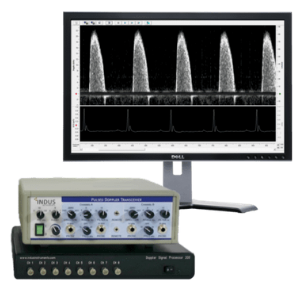
Doppler Flow Velocity System. Image Credit: Scintica Instrumentation Inc.
This protective mechanism allows the heart to adapt to increased blood demand by expanding arterial vessels and increasing blood flow to the heart, resulting in a hyperemic state. This hyperemic state can be caused by a vasodilator, exertion, or hypoxia.1-3
In most cases, measuring coronary flow velocity in one state, either baseline or hyperemic, is insufficient.
Both states are required to measure coronary flow reserve capacity, as coronary artery disease can be hidden under baseline conditions in many pathologies and is only revealed when the heart is under physiological demand during this hyperemic state.
Methodology
The data was collected using Indus’ Doppler Flow Velocity System (DFVS). The DFVS is a high-frequency, real-time pulsed Doppler measurement instrument with built-in data analysis software for measuring blood flow velocity in small animals.
As shown in Figure 1A, a 20 MHz small portable probe was used. Figure 1C depicts an enlarged picture of the probe tip, which measures roughly 2 mm in diameter. This provides a distinct advantage over previous ultrasonic systems by allowing for accurate alignment of blood flow with the probe.
The rodent surgical monitoring system (RSM+) was used to monitor important physiological parameters such as ECG, respiration, and core body temperature. Blood or ventricular pressures and oxygen saturation (SpO2) can also be recorded for research purposes.
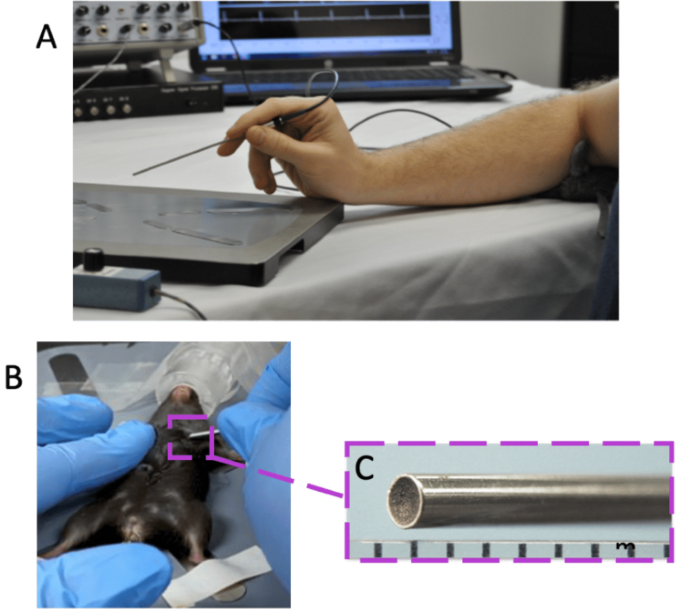
Figure 1. Overview of Doppler Flow Velocity System and Probe. A) typical system set-up for doppler flow velocity imaging, B) handheld probe orientation for coronary blood flow imaging, and C) the magnified inset of the probe tip. Image Credit: Scintica Instrumentation Inc.
The methodology outlined below is a generic protocol; however, specific models or research goals may necessitate changes to specific parameters. Mice, rats, and other small rodents were generally anesthetized at 2 liters per minute and placed supine on the RSM+ platform.
Once on the RSM+ platform, isoflurane levels were decreased to 1.5–2 % to maintain anesthesia.
ECG gel was applied to each leg and then taped to the platform’s electrodes using surgical tissue tape. A rectal temperature probe was placed to measure core body temperature throughout imaging.
Deviations from physiological norms can impact cardiac functioning in and of themselves. Too much anesthetic or too cold of an animal would naturally lower cardiac functioning, regardless of pathology.
Certain institutes standardize physiological measures, such as heart rate (450 ± 50 BPMs) and core body temperature (37 °C), to maintain reliability and high animal care.
For coronary flow, position the probe tip on the skin in the chest, towards the anterior basal surface of the heart immediately below the left upper limb, and hold it parallel (horizontal) to the animal platform surface.
Pulsed ultrasound is blocked by bone, and a window through the 2nd or 3rd intercostal gap on the animal's left side, as indicated in Figure 1B, is required.
*Modest heart rotational changes between animal strains and diseases will slightly affect probe orientation.
For this form of imaging, a micropositioner, a device designed to keep the probe stable, is recommended; tiny hand movements will decrease signal intensity and blood flow velocity peaks.
The depth range gate (sound penetration depth) should be set to 3–4 mm for mice. Depending on the size of the animal model used, this may need to be changed slightly.
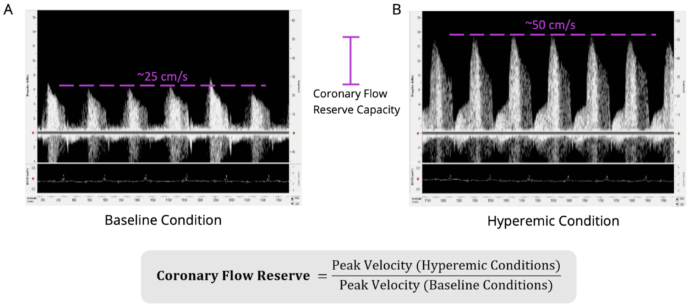
Figure 2. Coronary Flow Reserve Measurements and Imaging in Wildtype C57BL/6 Mouse. Shown is the A) coronary blood flow velocity at a physiologically baseline level (~1% isoflurane levels; peak blood flow velocity ~25 cm/second) and the B) same blood flow at a hyperemic level (~2.5% isoflurane levels; peak blood flow velocity ~50 cm/second). Scales are the same for both images (-15 to 65 cm/sec). The equation to calculate coronary flow reserve is shown below (the CFR for this animal would be 2.0 in this example). Isoflurane was used as a vasodilator, but vasodilator of choice can be used. Electrocardiogram was recorded simultaneously to ensure appropriate timing of obtainment of blood flow signals and to determine heart rate. The left anterior descending artery was measured. Image Credit: Scintica Instrumentation Inc.
Once an optimum Doppler image has been identified and the probe has been stabilized, isoflurane levels will be reduced to 1 %, and baseline data will be saved, as illustrated in Figure 2A.
To achieve hyperemic conditions, increase isoflurane levels to 2.5 % or provide a vasodilator, as shown in Figure 2B. Set isoflurane flow rates to around 1 % for baseline imaging and 2.5 % for hyperemic situations. Wait a few minutes between measurements until there is a consistent effect.
Isoflurane quickly exits the circulation and can be dropped and elevated numerous times to get independent data. Other vasodilators may only be able to photograph the baseline and hyperemic states once. If rats are scanned, a vasodilator should be used because isoflurane does not work as a vasodilator for these animals.
Depending on the number of repeated measurements, the total acquisition time for this measurement is between 10 and 15 minutes.
It should be emphasized that flow velocity can be measured in various vessels or different segments of each channel, with each vessel having its own distinct blood flow velocity pattern and sound. Figure 3 shows commonly measured vessels, and their blood flow velocity, with the coronary blood flow velocity, emphasized in purple.
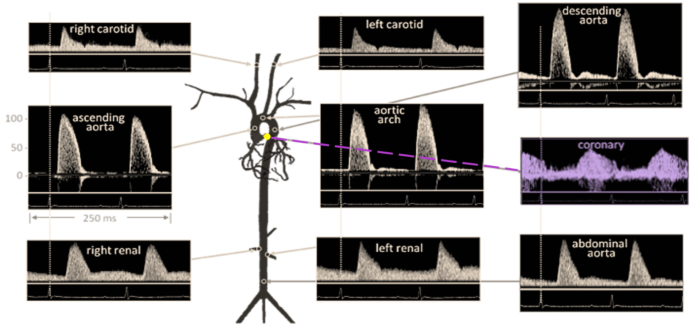
Figure 3. Doppler Signal from Mouse Aorta and Arteries. Velocities are similar in magnitude and shape to those from humans. Coronary blood flow velocity is highlighted in purple coloring. Diagram from Hartley et al., ILAR J 43:147-8, 2002.
Publication highlights
Recent examples highlight how coronary flow reserve imaging has helped researchers answer critical problems. These papers followed a similar protocol to the one described above, but there may have been subtle variations depending on their individual models and research goals.
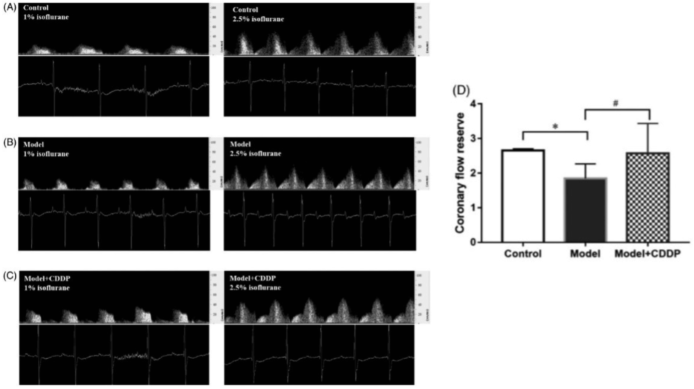
Publication 1. Pretreatment with compound Danshen dripping pills rescued coronary flow reserve capacity compared to lipid infusion-induced microvascular dysfunction mouse model. Coronary flow velocity imaging at baseline (left image) and hyperemic (right) for A) control c mouse, B) lipid infusion-induced microvascular dysfunction mouse model, and C) lipid infusion-induced microvascular dysfunction mouse model pretreated with compound Danshen dripping pills with D) aggregated results. *p < 0.05, Data and pictures from Zhang et al., Pharmaceutical Biology 58:701–706, 2020.4
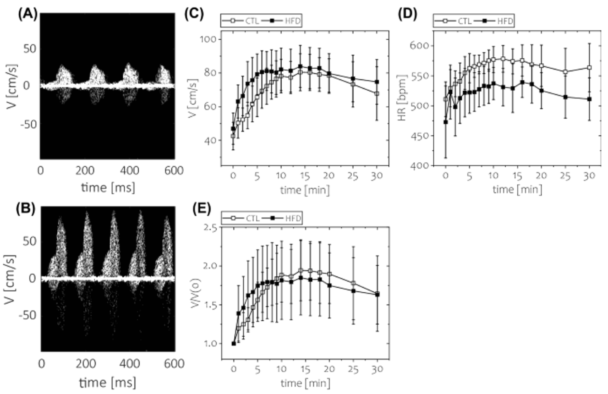
Publication 2. Short-term feeding of a high-fat diet (HFD) was not associated with impaired coronary flow reserve. Coronary flow velocity imaging was performed under two conditions: baseline and hyperemic (with regadenoson injection as a vasodilator). Time course of: C) absolute blood flow velocity, D) heart rate, and E) coronary flow reserve. *p < 0.05; n = 8 animals per group. Data and photos are from Kwiatkowski et al., Scientific Reports 11, 2021.5
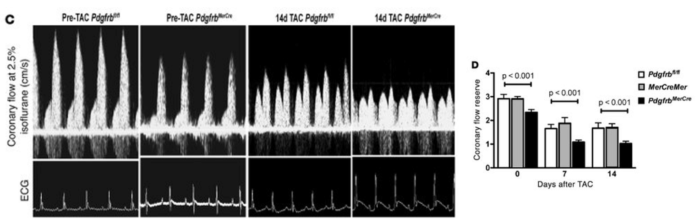
Publication 3. Pdgfrb knockout mice have reduced coronary flow reserve capacity compared to controls after TAC surgery. (C) Representative ultrasonography tracings of hyperemic coronary flow before and 14 days after TAC in control Pdgfrbfl/fl and PdgfrbMerCre mice. (D) CFR quantification in Pdgfrbfl/fl, MerCreMer, and PdgfrbMerCre mice (n = 7 per group at each time point). P values were calculated using ANOVA, and Tukey’s test indicated significant differences between PdgfrbMerCre and control mice (Pdgfrbfl/fl and MerCreMer). Data and photos from Chintalgattu et al., The Journal of Clinical Investigation, 120, 2010.6
References
- Gould, K.Lance., Lipscomb, K. and Hamilton, G.W. (1974). Physiologic basis for assessing critical coronary stenosis. The American Journal of Cardiology, 33(1), pp.87–94. https://doi.org/10.1016/0002-9149(74)90743-7.
- Johannes Wikström, et al. (2005). Functional and Morphologic Imaging of Coronary Atherosclerosis in Living Mice Using High-Resolution Color Doppler Echocardiography and Ultrasound Biomicroscopy. Journal of the American College of Cardiology, 46(4), pp.720–727. https://doi.org/10.1016/j.jacc.2005.04.053.
- Ronney Shantouf and Mehra, A. (2015). Coronary Fractional Flow Reserve. American Journal of Roentgenology, 204(3), pp.W261–W265. https://doi.org/10.2214/ajr.14.13933.
- Zhang, Y., et al. (2020). Pre-treatment with compound Danshen dripping pills prevents lipid infusion-induced microvascular dysfunction in mice. Pharmaceutical Biology, 58(1), pp.701–706. https://doi.org/10.1080/13880209.2020.1790619.
- Kwiatkowski, G., et al. (2021). MRI-based in vivo detection of coronary microvascular dysfunction before alterations in cardiac function induced by short-term high-fat diet in mice. Scientific Reports, [online] 11(1). https://doi.org/10.1038/s41598-021-98401-1.
- Vishnu Chintalgattu, Ai, D., et al. (2010). Cardiomyocyte PDGFR-β signaling is an essential component of the mouse cardiac response to load-induced stress. Journal of Clinical Investigation, 120(2), pp.472–484. https://doi.org/10.1172/jci39434.
About Scintica Instrumentation Inc.
Scintica Instrumentation Inc., a high value distributor of scientific medical equipment, was created as a joint venture between two companies, Indus Instruments and ONS Projects Inc., both with long standing experience in the medical device instrumentation field. Indus Instruments is an engineering and manufacturing company with excellence in designing and producing sophisticated products for both medical and other high-tech clients in aerospace, chemical and oil and gas industries. ONS Projects Inc. is a life science investment and marketing company built on the foundation of two other successful manufacturing companies in the laboratory instrumentation field,
The principals of the two companies each have more than 25 years of experience of manufacturing, selling and supporting scientists in their research around the world. Our team consists of scientists, applications experts, engineers and sales professionals from a cross section of backgrounds, who excel at simplifying transactions and ensuring that scientists have the best equipment for achieving research excellence.
At Scintica Instrumentation, we distribute for selected manufacturers from all over the world and represent them in multiple countries including the United States, Canada, and Europe, as well as in Asia through a network of authorized sub-distributors.
Sponsored Content Policy: News-Medical.net publishes articles and related content that may be derived from sources where we have existing commercial relationships, provided such content adds value to the core editorial ethos of News-Medical.Net which is to educate and inform site visitors interested in medical research, science, medical devices and treatments.