Introduction
Heparin is an injectable anticoagulant that has been used for medical purposes for more than seven decades. However, this agent has come under considerable scrutiny after certain pharmaceutical lots have been found to contain chondroitin sulfate. Therefore, advanced characterization techniques are needed to accurately determine the exact chemical composition of heparin lots.
Measuring electrophoretic mobility is helpful in ascertaining the average molecular charge. Along with the molecular weight, the net charge can be used to discriminate heparin lots that are contaminated with super-sulfated molecules. This discrimination is achieved using the ratio of molar mass to molecular charge. Molar mass is ascertained by size exclusion chromatography coupled with multi-angle light scattering (SEC-MALS) and molecular charge by electrophoretic light scattering (ELS).
Sample Preparation and Instrumentation
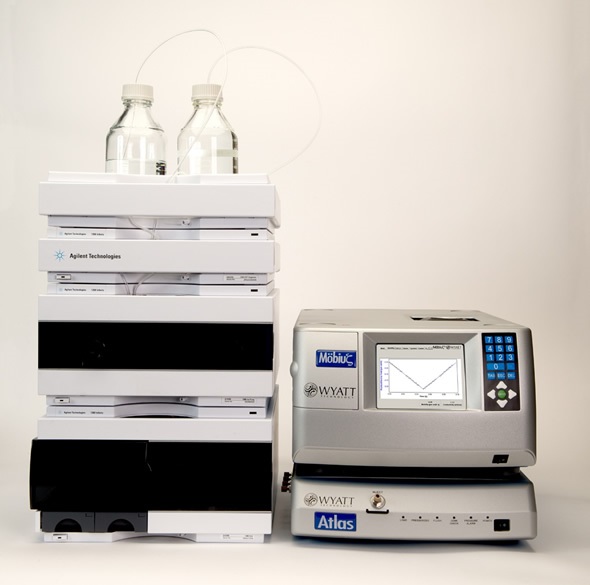
First, heparin samples were mixed in 0.1 M ammonium acetate to a final concentration of ~5 mg/mL and left to equilibrate at room temperature. ELS was then carried out using the Wyatt Möbius®. Samples were filtered to 0.02 µm and injected into the Möbius flow cell. Electrophoretic mobility was quantified concurrently with hydrodynamic radius using dynamic light scattering (DLS). Figure 1 shows the instrument used for the analysis.

Figure 1. Instrumentation - Möbius and Atlas high-salt accessory.
The polydispersity and molar mass of fractionated and unfractionated heparin samples were determined using SEC-MALS. Samples that were not filtered were loaded onto a chromatography column and the molar mass of the eluting sample was determined by means of an Optilab® rEX refractive index detector and DAWN® HELEOS® MALS detector.
Results and Discussion
Slight differences were observed in the molar mass of the unfractionated heparin samples, but the difference was too small to draw any conclusion over whether a given heparin lot was contaminated with super-sulfated material, as shown in Table 1. In addition, distinguishing the hydrodynamic radius of the pure heparin from the contaminated sample is difficult to achieve.
Table 1. Weight-average molar mass and z-average hydrodynamic radius of unfractionated heparin samples.
| |
Mw (kDa)
|
rh (nm)
|
|
Unfractionated Heparin, Supplier 1
|
15.9 + 0.1
|
2.30 + 0.02
|
|
Unfractionated Heparin, Supplier 2
|
18.8 + 0.3
|
2.48 + 0.01
|
|
Unfractionated Heparin, Supplier 3
|
17.9 + 0.0
|
2.49 + 0.02
|
Since it was anticipated that the sample’s negative charge would increase in the presence of super-sulfated material, electrophoretic mobility was measured to see whether the net charge could be used to distinguish pure heparin from contaminated samples.
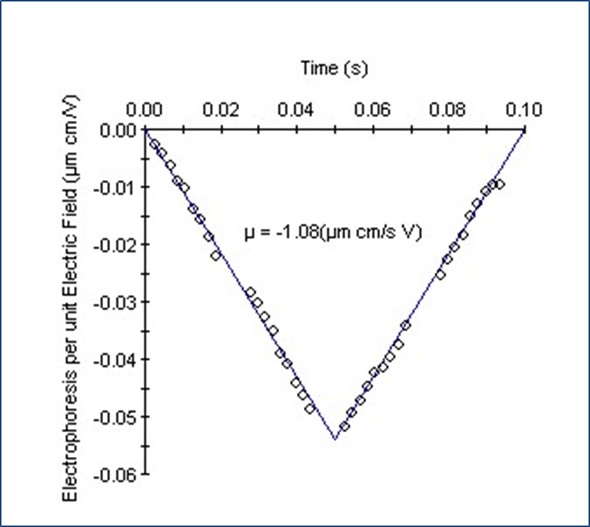
Figure 2 shows a typical ‘V-graph’ for the electrophoretic mobility measurement. The data denotes the average of 300 electric field oscillations multiplexed across 30 detectors.

Figure 2. Electrophoretic mobility data for unfractionated heparin from Supplier 1.
The negative electrophoretic mobility (µ) results from the negative net charge for the heparin sample. The zeta potential and net charge are then ascertained from the hydrodynamic radius and the electrophoretic mobility. Table 2 shows these parameters for fractionated heparin standards (NHP) and unfractionated heparin samples.
Table 2. Mobility, effective charge, zeta potential, hydrodynamic radius for unfractionated heparin samples and fractionated standards.
|
|
Mobility ((µm*cm)/(s*V))
|
Effective charge (Z*)
|
Zeta Potential (Z*)
|
rH (nm)
|
|
Unfractionated Heparin, Supplier 1
|
-1.00 ± 0.05
|
-7.1 ± 0.40
|
-16.9 ± 0.9
|
2.30 ± 0.02
|
|
Unfractionated Heparin, Supplier 2
|
-1.18 ± 0.09
|
-9.3 ± 0.64
|
-19.5 ± 1.5
|
2.48 ± 0.01
|
|
Super-sulfated Heparin, Supplier 2
|
-1.46 ± 0.12
|
-11.2 ± 0.96
|
-23.8 ± 1.9
|
2.49 ± 0.02
|
|
NHP III
|
-0.42 ± 0.03
|
-3.2 ± 0.26
|
-7.9 ± 0.57
|
2.19 ± 0.02
|
|
NHP IV
|
-0.65 ± 0.10
|
-4.2 ± 0.56
|
-11.8 ± 1.7
|
2.09 ± 0.02
|
|
NHP VI
|
-0.86 ± 0.05
|
-7.1 ± 0.39
|
-15.8 ± 0.9
|
2.43 ± 0.02
|
|
NHP VII
|
-0.85 ± 0.10
|
-14.2 ± 1.8
|
-14.2 ± 1.7
|
3.74 ± 0.03
|
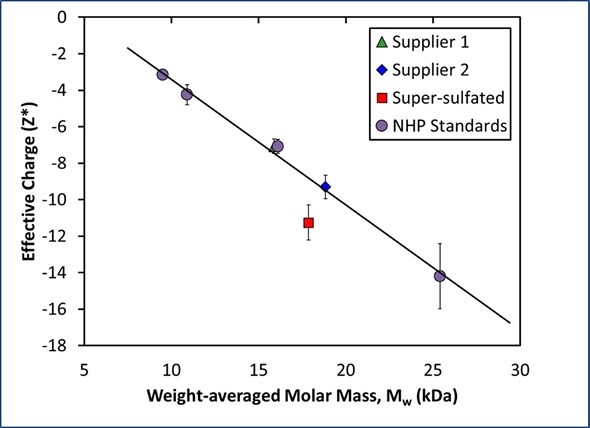
As expected, the super-sulfated material showed the largest net charge of the three unfractionated heparin samples. However, the deviation in charge between the super-sulfated and pure samples was of the same magnitude as the deviation in charge for the two suppliers. This deviation may only show the variation in polydispersity or molar mass, therefore indicating that net charge by itself is not sufficient to characterize different heparin lots. When both mass and charge are taken together, however, the pure heparin samples can be easily distinguished from the super-sulfated samples (Figure 3).

Figure 3. Measured net charge and molar mass for heparin standards exhibits a linear relationship, indicating a constant charge:mass ratio.
A calibration curve for pure heparin was produced based on the net charge and molar mass of the fractionated heparin standards (NHP III, IV, VI, and VII). These samples produce a linear association between molar mass and net charge for pure heparin, indicating a constant charge:mass ratio (Figure 3).
Based on their molecular weight measurements, the net charges for unfractionated heparin from Suppliers 1 and 2 are within a 2% range of the predicted value. On the other hand, the measured net charge of the super-sulfated heparin from Supplier 2 is approximately 30% higher than the value expected for a heparin of that size.
Conclusion
From the above results, it is clear that effective molecular charge can be distinguished quickly and non-destructively using concurrent measurements of hydrodynamic radius and electrophoretic mobility. The increase in negative charge is constant with an increase in sulfate groups in the altered heparin sample.
The combined measurements of charge and molar mass for each heparin sample create a fingerprint for pure heparin that is quite distinct from that of contaminated samples. The obvious differentiation in the effective charge:mass ratio between super-sulfated and unmodified heparin means that this value can be utilized as a metric for qualifying different lots of heparin.
Reference
Adapted with permission from "Discriminating Heparin from Chondroitin Sulfate by Charge:Mass Ratio" by Wyatt Technology Corp. Graphs and illustrations reprinted with permission from Wyatt Technology.
About Wyatt
 With a long history of excellence in scientific instrumentation, Wyatt Technology is the recognized leader in innovative light scattering instruments, accessories, software and services for determining the properties of macromolecules and nanoparticles in solution. Wyatt provides cutting-edge solutions for in-line multi-angle static light scattering (SEC-MALS), field-flow fractionation (FFF-MALS), composition gradients (CG-MALS), high-throughput and traditional dynamic light scattering (DLS), electrophoretic mobility via phase-analysis light scattering (MP-PALS), differential refractometry and differential viscosity. With a staff composed of 20% Ph.D. scientists and many more dedicated and experienced support personnel, Wyatt's aim is to delight the customer with the best products, training, customer support and service available in the industry.
Sponsored Content Policy: News-Medical.net publishes articles and related content that may be derived from sources where we have existing commercial relationships, provided such content adds value to the core editorial ethos of News-Medical.Net which is to educate and inform site visitors interested in medical research, science, medical devices and treatments.