The stabilization of microtubules is a key function of tau proteins. In fact, several neurodegenerative diseases, like Parkinson’s disease and Alzheimer’s disease 1, 2, are characterized by the self-aggregation of tau proteins.
Better treatment options, improved screening tools, and potential prevention of these diseases can be realized by understanding the aggregation pathway.
Several techniques — like quantitative and qualitative electron microscopy, sedimentation assays, and extrinsic and intrinsic fluorescence3 — are available to determine tau aggregation. Conversely, these methods are known to have certain drawbacks — for example, tiny proteins (tau monomer ~45–65 kDa) cannot be quantified or detected (microscopy), an external marker or dye is needed (extrinsic fluorescence), and also many tau constructs lack tryptophan residues (for intrinsic florescence).
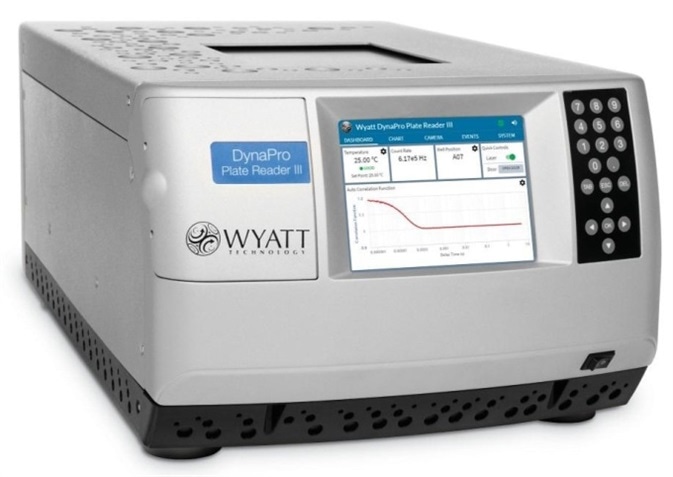
In this analysis, static and dynamic light scattering using the DynaPro Plate Reader was employed to determine the aggregation rate of tau proteins. Several challenges associated with conventional aggregation assays for tau proteins4 can be addressed through light scattering measurements. The molecules can be characterized in solution without needing any particular amino acids and without having to add an external probe. Moreover, the DynaPro Plate Reader’s high-throughput format allows for in-situ measurements to be made over a range of conditions and without perturbing the samples.
Materials and Methods
Professor Claudio Soto at The University of Texas Health Science Center at Houston Solutions provided soluble tau proteins as well as seed aggregates.
All the samples were analyzed using the DynaPro Plate Reader. Tau protein solutions were produced with and without seeds, then filtered to 0.02 μm, and finally transferred to a 96-well plate from Corning. For every solution, 100 μL of the sample was dispensed in duplicate into the 96 well plate. Evaporation was prevented by applying a microwell plate-sealing tape from Nunc, and soon afterward, the well plate was inserted into the DynaPro Plate Reader, which was stabilized at 37 °C. DYNAMICS software was used to perform data collection, including acquiring images of every well, and also used to carry out light scattering data analysis.
Once the well plate was inserted into the DynaPro Plate Reader, quality control data (see Results and Discussion: Section 1) were instantly determined. To assess the aggregation rate (see Section 2), all the wells were scanned every 30 minutes over the duration of 14 hours. Size distribution data (see Section 3) were also tracked throughout.
Results and Discussion
Section 1. Quality Control of Starting Materials
To evaluate the initial stages of aggregation, the starting materials should be pure and free of contaminating particles. The tau “monomer,” in this case, seemed to be a homogenous solution of species with a radius of about 10 nm. This value is much greater than anticipated for a linear polymer or globular protein having the same molar mass as that of the actual tau monomer (65 kDa). The observed size indicates that oligomeric “pre-aggregates”, rather than pure monomers, are present in the solution, although, for the sake of convenience, this solution will be referred to as “monomers.”
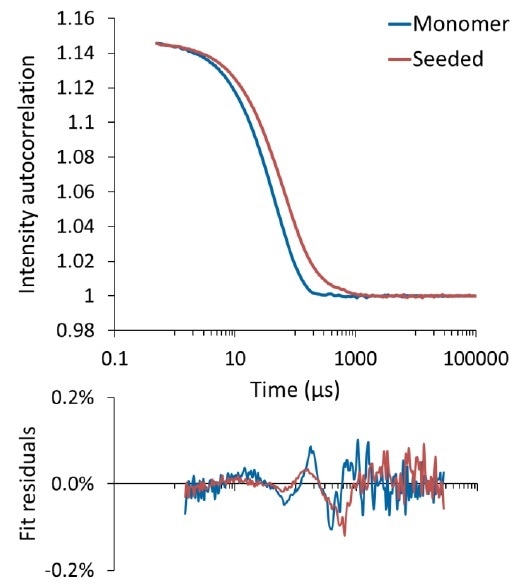
Figure 1 shows the autocorrelation functions, or ACF, for tau solutions with and without seeds.

Figure 1. Autocorrelation function for tau "monomer" (blue) and seeded with aggregates (red). The bottom panel shows the fit residual between the measured ACF and cumulants fit.
A single, smooth decay, displayed by both autocorrelation functions, represents a predominantly monomodal sample. The resultant data were fit to a cumulant model, producing Rh = 17.4 ± 0.8 nm and Rh = 11.9 ± 0.2 nm for the seeded samples and the “monomer”, respectively.
Figure 1 shows small and random fit residuals, which support the application of a cumulants analysis and indicates that a single diffusion coefficient (hydrodynamic radius) dominates the solution with a certain standard deviation (polydispersity).
Within the initial five minutes of incubation at 37 °C, an appreciable increase was observed in the average hydrodynamic size for the solution comprising seeds (17.4 nm in comparison to 11.9 nm), which is apparent in the ACF (see Figure 1). Moreover, the seeded sample’s polydispersity was considerably larger when compared to the “monomer” sample. These two data sets support the theory that in the presence of these seed particles, the tau monomer has already started to aggregate. It must be noted that while the aggregate seeds measured greater than 500 nm, they were introduced into the solution at very low concentration and therefore they did not appreciably contribute to the scattering intensity and were not regarded as an individual species by regularization analysis (see Section 3, “Size distribution of tau and aggregates”).
Section 2. Measuring Tau Aggregation Rate
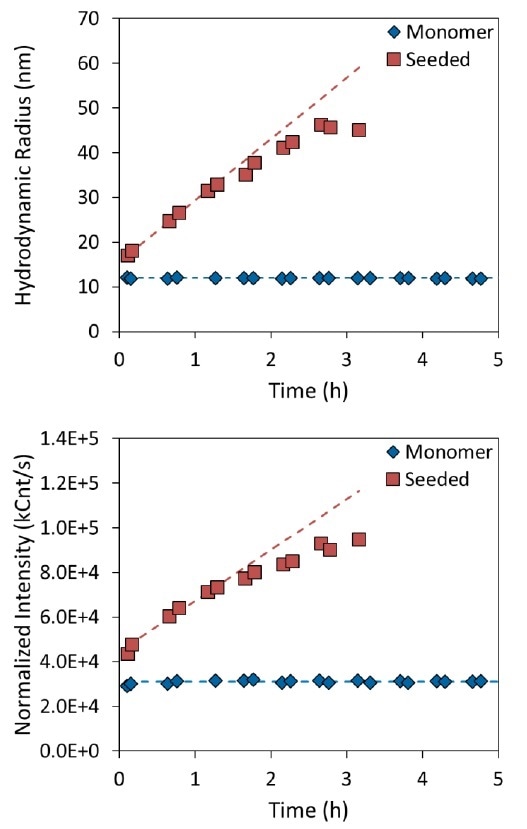
Within the “monomer” solution, oligomeric tau species seem to be stable over manifold hours at 37 °C. The light scattering intensity and hydrodynamic radius for these kinds of molecules were constant as a function of time, indicating that aggregation was not occurring anymore (see Figure 2, blue diamonds). As a matter of fact, both measures continued to be constant for more than 14 hours.

Figure 2. Measurement of tau aggregation rate in the presence (red squares) or absence (blue diamonds) of aggregate seeds. The top panel shows the increase in hydrodynamic radius as a function of time, and the bottom panel shows the normalized intensity.
For a change in size, only a tiny amount of aggregate seeds needs to be introduced. The seeds instantly produced steady aggregation, leading to an increased hydrodynamic radius as well as total scattering intensity (see Figure 2, red squares). Given that the normalized intensity is relative to the solution’s weight-average molar mass, it was concluded that the change in size was the result of increased molar mass, and not caused by a conformational change.
A polynomial in the DYNAMICS software was then fitted with aggregation rate data (see Figure 2, dashed lines). When the “monomer” data were fitted to a zero-order polynomial, an average light scattering intensity of 3.1×10⁴ kCnt/second and an average hydrodynamic radius of 12.0 nm were yielded. The initial aggregation rate for the seeded tau solution was established by fitting the initial hour of data to a straight line. The scattered intensity of the seeded solution increased at a rate of 4.5×10⁴ (kCnt/second)/hour, while the radius grew at an initial rate of 13.7 nm/hour.
Section 3. Size Distribution of Tau and Aggregates
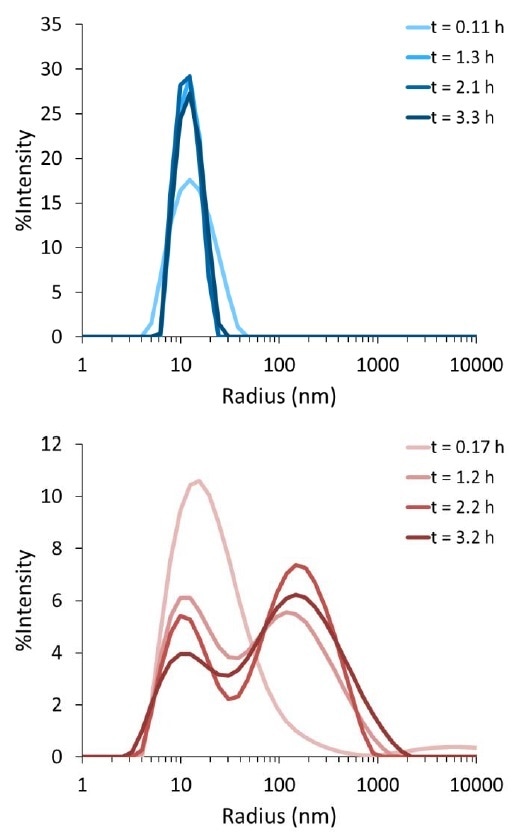
Figure 2 shows the data that were produced by fitting the ACF to a cumulants model to give an average particle radius. An analysis like this can be used for viewing trends over time and measuring the aggregation rate; however, it does not provide any data related to the particle size distribution. However, the ACF in the DYNAMICS software can be fitted with a regularization model to create size distribution plots. The size distribution plots for the tau solutions as a function of time are shown in Figure 3. At an early time point, both solutions are mainly composed of a single size species with radius of about 10–20 nm. This corresponds with Figure 1, which demonstrated that both solutions fit well to the cumulants model at early time points.

Figure 3. Distribution of particle sizes for tau protein solution (top) and aggregate-seeded tau solution (bottom) as a function of incubation time at 37 °C. Histograms for initial measurements are colored lightest, and measurements after ~3 hours of incubation are colored the darkest.
Over the initial three hours, no major change was exhibited by the size distribution of the “monomer” tau solution. By contrast, the tau solution containing the aggregate seeds begins as a monomodal size distribution and develops into a bimodal distribution within a period of one hour. Over the duration of three hours, an aggregate population with radius ~200 nm increases, while the population with radius ~10 nm decreases. This observation combined with the aggregation rate shown in Figure 2 can give a better understanding about the aggregation mechanism.
Conclusions
Dynamic light scattering, using the DynaPro Plate Reader to simultaneously track various samples and conditions, provided a deeper understanding of protein aggregation related to neurodegenerative diseases. The tau “monomer” solution, in this case, was observed to contain oligomers whose hydrodynamic radius was approximately 10 nm. Such pre-aggregates remained stable at 37 °C for more than 14 hours.
The addition of aggregate seeds contributed to the growth of tau oligomers into larger aggregates. As soon as the seeds were added, the aggregation of tau proteins seemed to occur instantly—even without agitation. While the aggregation rate was established by light scattering, variations in size distribution were also measured, which may shed more light on the aggregation mechanism.

References
- Soto, C. In Vivo Spreading of Tau Pathology. Neuron 73, 621–623 (2012).
- Arrasate, M., Pérez, M., Armas-Portela, R. & Ávila, J. Polymerization of tau peptides into fibrillar structures. The effect of FTDP-17 mutations. FEBS Lett. 446, 199–202 (1999).
- Luo, J., He, R. & Li, W. The fluorescent characterization of the polymerized microtubule-associated protein Tau. Int. J. Biol. Macromol. 27, 263–268 (2000).
- Zhu, H.-L. et al. Quantitative characterization of heparin binding to Tau protein: implication for inducer-mediated Tau filament formation. J. Biol. Chem. 285, 3592–3599 (2010).
About Wyatt Technology
Wyatt Technology Corporation develops instrumentation, software and techniques for the characterization of macromolecules and nanoparticles, in solution, based on light scattering and related technologies. The physical properties determined by Wyatt’s products include absolute molar mass of proteins, polymers and other macromolecules; size and charge (zeta potential); protein-protein and other biomolecular interactions; composition of conjugated proteins and co-polymers; and macromolecular conformation.
Products and Services
Wyatt’s product line includes instruments and software for:
- on-line multi-angle light scattering (MALS), used in conjunction with size-exclusion chromatography to quantify absolute molar mass, size, conformation, conjugation and aggregation
- traditional (cuvette-based) and high-throughput (microwell plate-based) dynamic light scattering (DLS) to determine size (radius) and size distributions, protein melting temperature and stability-indicating parameters
- electrophoretic mobility (PALS) to determine molecular charge/zeta potential
- composition-gradient light scattering for label-free analysis of biomolecular interactions
- field-flow fractionation for separation of macromolecules and nanoparticles from 1-1000 nm, used in conjunction with on-line light scattering and other detection technologies to quantify molar mass and size
Wyatt also offers, on a limited basis, sample analysis services utilizing its unique technologies.
Sponsored Content Policy: News-Medical.net publishes articles and related content that may be derived from sources where we have existing commercial relationships, provided such content adds value to the core editorial ethos of News-Medical.Net which is to educate and inform site visitors interested in medical research, science, medical devices and treatments.