Although surface plasmon resonance and bio-layer interferometry are broadly accepted and are considered valuable instruments for studies that screen drug candidate molecules, the quality of the data they generate is limited by the solutions loaded onto the tools. Preliminary sample protein and solution quality evaluation is essential for reliable binding outcomes.

Image Credit: Waters | Wyatt Technology
Dynamic light scattering is frequently utilized to assess the quality of protein aggregation, degradation and solution. However, for high-throughput screening, conventional dynamic light scattering detection is unfeasible, as these tools operate with single-sample microcuvettes and the required labor would be relatively costly.
The DynaPro® Plate Reader resolves this problem by assessing dynamic light scattering in situ in industry-standard microwell plates and performing automated, non-perturbative quality assessments with minimum time and effort.
Following analysis via DynaPro, a ‘heat map’ generated by the software provides a rapid visual scan of the aggregation state in each well. This makes it possible to examine particle size distributions with greater precision. The operator can easily distinguish which solutions are best suited for binding assays to ensure confidence in the results.
Next, the plates can be transferred to the SPR or BLI tool with no intermediate fluid handling or perturbation. Such a seamless workflow significantly increases productivity when discovering new drugs.

Aggregates may impact SPR and BLI measurements in several ways. Image Credit: Waters | Wyatt Technology
Introduction
Surface plasmon resonance (SPR) and bio-layer interferometry (BLI) are dynamic and commonly used approaches for high-efficiency screening and discovering candidate biotherapeutics.
In high-throughput SPR, molecules distinguished as critical treatment targets are immobilized on a chip, and solutions of possible binding partners are injected at one or more concentrations to evaluate affinity and kinetics of interaction.
In BLI, targets or candidates are immobilized on fiber optic probes and then dipped into microwells that contain solutions of opposing molecules. The screening results in the selection of one or more candidate therapeutic molecules with beneficial characteristics, including high affinity and rapid binding kinetics.
In a typical screen, dozens to hundreds of candidates can be tested, so a large number of high-efficiency SPR tools are built to draw samples from standard microwell plates and inject them into microfluidic channels. The analyte flows over the immobilized target molecule, where good candidates quickly settle onto the chip’s surface through specific association with the target epitope.
A similar procedure occurs in BLI. However, no microfluidics are implicated. An optical probe then generates a signal corresponding to an increase in surface-bound mass, and analyzing these signals over several analyte concentrations provides affinity and kinetics.
Sample quality is a commonly overlooked hurdle to proper candidate selection. The purity and solution characteristics of molecules used in SPR and BLI screening might negatively affect assessments in two key ways: 1) data quality and 2) microfluidic integrity.
An excellent tool is currently available for sample quality analysis. High-throughput dynamic light scattering (HTDLS) with Wyatt’s DynaPro Plate Reader illuminates protein quality without perturbing the solution. It also takes measurements in the same microwell plates utilized by high-throughput discovery screening platforms.
HT-DLS makes rapid evaluation of sample solutions possible before loading them onto the SPR or BLI tool. It can catch poor-quality materials before they can be plugged into the microfluidics or waste time and resources on unnecessary assessments.
As an extra plus side, DLS can identify the analyte’s diffusion coefficient, a key characteristic in SPR tests for distinguishing limitations in mass transfer.
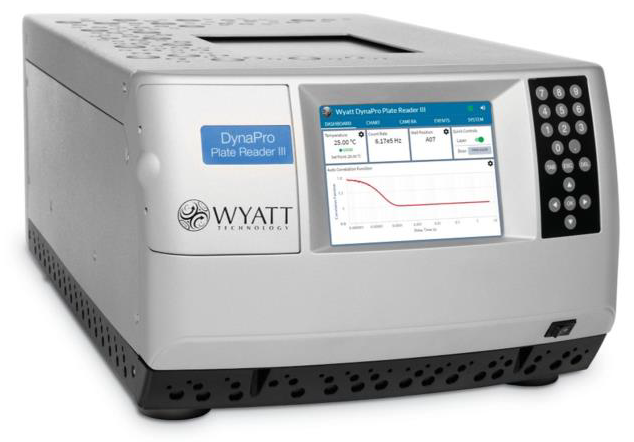
Figure 1. The DynaPro Plate Reader assesses solution quality in stand-ard 96, 384 or 1536 well plates, without perturbing the samples. Image Credit: Waters | Wyatt Technology
The importance of analyte quality I: Impurities
As with most approaches, SPR and BLI are susceptible to experimental science's unavoidable, fundamental law, concisely put as ‘garbage in, garbage out’. Although frequently ignored, analytical quality is essential for receiving precise and meaningful assessments that eventually result in selecting the most ideal therapeutic candidates—and thus optimal clinical outcomes.
Low molecular weight impurities, including extractable and leachable, typically have a relatively low impact on SPR and BLI assessments. However, large impurities, including aggregates and foreign particles, can negatively affect assessments by the two approaches. Large impurities lend to four basic types of experimental uncertainty in SPR and BLI assessments: noisy signals, spurious signals, imprecise concentrations, and skewed kinetics.
The evanescent optical fields that probe binding do not extend far into the solution, which is generally a few hundred nanometers. However, any nanoparticle or aggregate that passes within that distance from the surface of the chip or fiber probe prompts a signal spike that is roughly proportional to its mass.
Consider a 100 x 100 µm² surface immobilized with bound ligands and illuminated by the SPR beam. Exposing this surface to a concentration of analyte >> Kd leads to complete coverage and maximal binding signal.
Next, consider a single contaminating nanoparticle of ~5 µm diameter in that analyte solution. As the contaminant contains the same volume as the bound analyte, upon passing very close to the chip or probe surface, this particle can produce a noise spike in the binding signal similar to all bound analytes.
Smaller nanoparticles and aggregates that might be present in higher quantities in a sample of low quality will generate a regular stream of minor fluctuations in signal, resulting in a degraded optical response. The two effects are portrayed in the simulated sensorgrams displayed in Figure 2.
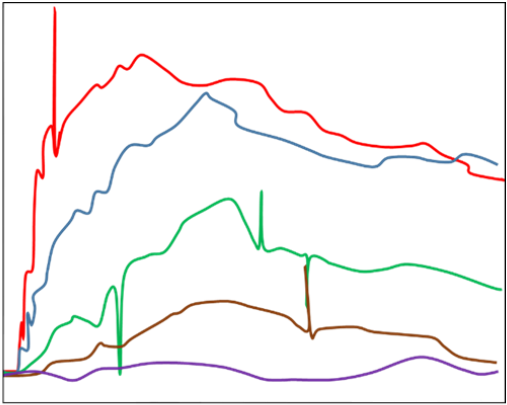
Figure 2. Sensorgram obtained in the presence of aggregated analyte (simulated). Image Credit: Waters | Wyatt Technology
Analyte aggregates may or may not be active. If active and present in preferred amounts (e.g., > 5 % total analyte protein mass), the aggregates will bind to the immobilized ligand and produce an SPR or BLI signal bigger than that of the expected monomeric interaction, skewing the binding response to a higher approximated affinity and on rate.
Aggregates expressing several binding sites might display ‘avidity’ effects – simultaneously interacting with different immobilized molecules or demonstrating a lower dissociation rate by hopscotching on the surface of the chip, resulting in a large overestimation of affinity.
If analyte aggregates are inactive, the effective concentration is lower than the assessed total concentration, resulting in reduced binding and a clear reduction in affinity. In any case, aggregates result in incorrect quantification of candidate binding characteristics (Figure 3).
Adding active non-monomeric species with various diffusion characteristics and binding kinetics compared to the monomer might negatively affect the time-dependent sensorgrams. As the analysis predicts a single binding species with distinct on and off rates, the presence of several binding species generates binding curves that cannot correctly fit under normal assumptions.
The importance of analyte quality II: Self-associating analyte
For standard SPR and BLI analyses, the analyte must be monomeric in the solution at the concentrations used in the experiment. The previous section addressed the negative effects of irreversibly aggregated materials on the analysis. Poorly formulated or ‘sticky’ analytes might self-associate both reversibly and irreversibly.
When this is the case, the analyte monomer is in dynamic equilibrium with small oligomers, including dimers or tetramers, and the actual concentration of monomers differs with protein concentration. How the final assessment is affected relies on the activity and presentation of binding sites, where active oligomers result in overestimations of affinity and inactive aggregates result in underestimates (Figure 4).
Furthermore, presenting many binding sites could result in avidity effects and large affinity overestimations.
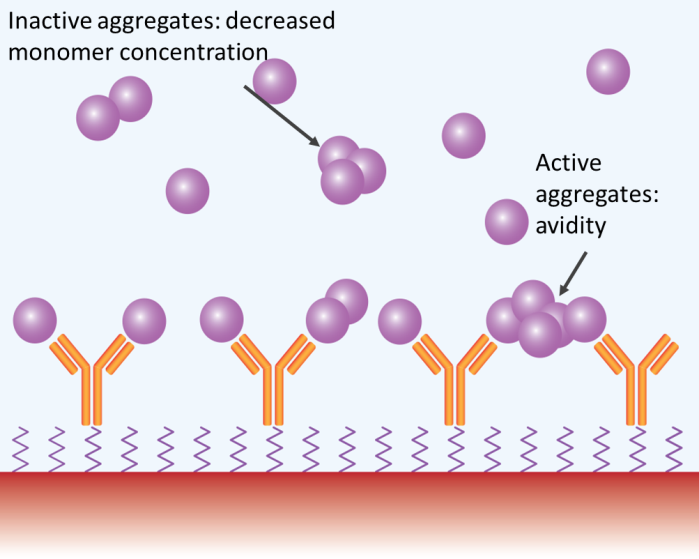
Figure 3. Aggregates may impact SPR and BLI measurements in several ways. Image Credit: Waters | Wyatt Technology
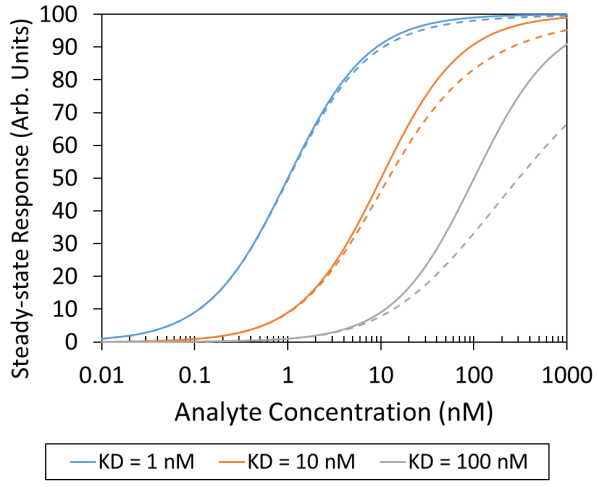
Figure 4. Analyte self-association with Kd= 100 nM can shift the apparent analyte-ligand equilibrium isotherm from the expected curve (solid line) to the measured curve (dashed line). In this analysis the dimer was assumed to be inactive. Image Credit: Waters | Wyatt Technology
The importance of substrate protein quality
Aggregated analytes and aggregated immobilized proteins may result in experimental errors. The presence of protein aggregates on the chip or fiber probe surface, in particular, will likely result in less active material or a decrease in the average quantity of exposed epitopes for every immobilized mass. As a result, aggregated substrate proteins reduce apparent affinity.
Where is the drain opener?
Heavily aggregated or impure material carrying large particulates can result in another extremely harmful effect: clogged microfluidics in multichannel SPR. These fluidic channels are typically narrow but lengthy and are susceptible to plugging from agglomerated proteins or other ‘nanocrud.’
Clogging events in the center of a screen of dozens or hundreds of candidates can destroy weeks, if not months, of effort in protein expression, purification, and preparation. This includes all the work committed to developing analytical methods and assessing SPR immobilization protocols.
Recovery of plugged microfluidics may be as easy as replacing a chip; however, it may also involve time-consuming system cleaning and maintenance. The damages can add up to several thousands of dollars, even before considering productivity losses.
Dynamic light scattering
Dynamic light scattering (DLS) is a noninvasive, nonperturbative optical approach to assessing the size distribution of nanoparticles in solution/suspension, from smaller than 1 nm up to several micrometers.
DLS works via the principles of Brownian motion to identify particle diffusion rates in solution. The data is transformed by DYNAMICS® software into a particle size distribution, which can be assessed to understand whether it is safe to inject the solution into SPR microfluidics and whether the SPR or BLI assessments will generate quality results.
DYNAMICS offers automated analysis and visualization of DLS results in a heat map that indicates good, intermediate, and poor protein quality. The whole procedure can be finished quickly before loading onto the interaction apparatus by transferring the microwell plate into the DynaPro HT-DLS system, running the sample screen, and lastly (when not contra-indicated) loading the same microwell plate onto the SPR or BLI tool.
It is possible to deselect microwells demonstrating low-quality material in the interaction screening protocol.
Molecules and nanoparticles in solution or suspension ‘jitter’ owing to Brownian motion, a result of the thermal energy of solvent molecules and the momentum given to the nanoparticles by collisions. In DLS, a laser beam impinges on the nanoparticles and is partly scattered in every direction.
Light waves scattered by various nanoparticles reach the detectors at diverse phases and thus interfere either constructively or destructively with them according to the specific phase difference among them, as demonstrated in Figure 5.
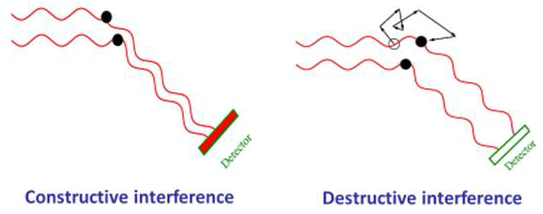
Figure 5. As molecules move through Brownian motion, the light scattered from each molecule traverses a different path. This leads to constructive or destructive interference at the light scattering detec-tor. When scattered waves interfere constructively, the DLS detector records high light intensity; conversely when waves interfere destructively, the detector records low light intensity. Image Credit: Waters | Wyatt Technology
Scattered light’s measured intensity rises and falls over the time scale characteristic of diffusion. DLS records these fluctuation rates to calculate translational diffusion coefficients Dt. As outlined in Figure 6, diffusion coefficients are transformed to particle sizes using the Stokes-Einstein equation: Rh=kBT/6πηDt, where is the particle’s hydrodynamic radius is Rh, Boltzmann’s constant is kB, the absolute temperature is T, and the solvent viscosity is η.
Figure 7 displays three typical %-intensity size distributions calculated by DLS. The red and blue curves stem from monomodal populations of BSA (Rh = 3.8 nm) and polystyrene spheres with a radius 50 nm, respectively. The green curve comes from a solution containing a high proportion of monomeric protein, Rh ~ 4 nm, alongside some large aggregates with Rh ~ 50 nm.
As the scattered intensity corresponds to the molar mass, the %-intensity curve is largely weighted towards large particulates. The total mass of polystyrene beads is significantly smaller than that of the BSA. The actual aggregate vs. monomeric protein quantity can be predicted using the %-mass size distribution graph (not displayed).
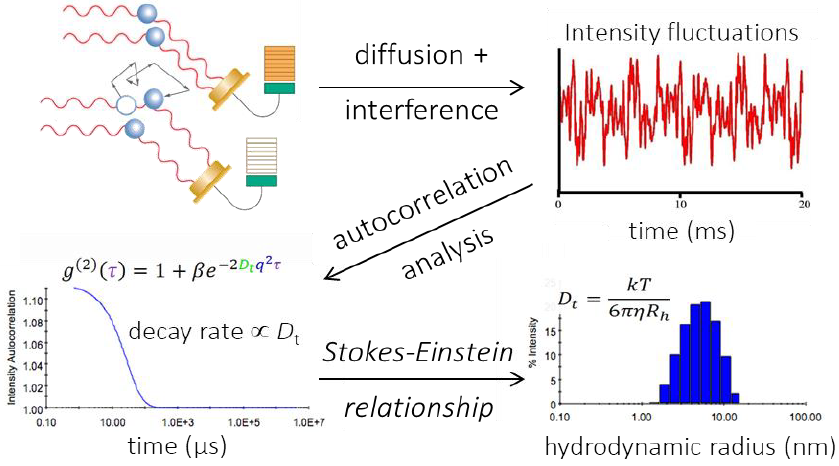
Figure 6. Autocorrelation analysis is the mathematical transformation linking light intensity fluctuations to the diffusion coefficient. Following autocorrelation, DYNAMICS converts the diffusion coefficients to size. Image Credit: Waters | Wyatt Technology
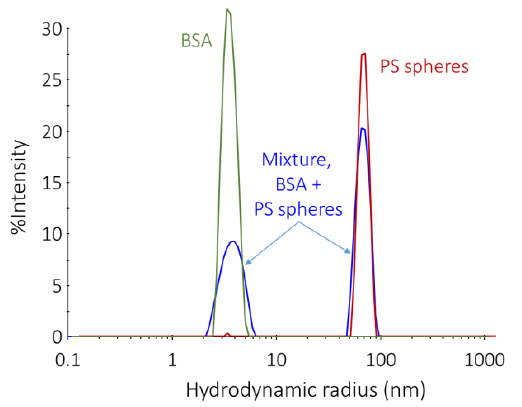
Figure 7. Representative size distributions determined by DLS. Image Credit: Waters | Wyatt Technology
DLS has insufficient resolution to distinguish monomers from dimers or other small oligomers. It can generally only resolve nanoparticle populations that vary in size by 3-5x in radius (equivalent to around 100x in mass). However, the presence of small aggregates is inferred through the breadth of the peak (known as polydispersity) or shifts in the average value of Rh for the population.
HT-DLS does the job quickly and easily
Traditional DLS occurs manually in a microcuvette, one sample after the other. Testing all the hundreds of candidates to be screened this way would not be possible, although cuvette-based DLS may still have value for other quality assays.
At the same time, the DynaPro Plate Reader has the power of HT-DLS for quality assessment of the target and all candidates, owing to its microwell-plate-based format with in situ, non-perturbative assessments.
With no fluidics, the DynaPro is not concerned about possible sample carryover among the wells. Assessments may be rapidly completed, usually demanding 10-30 seconds for each well, including transition time among wells. The whole screen is set up to proceed without monitoring in the DYNAMICS software package.
In HTS-DLS applications, DYNAMICS is typically configured to bin the data as a heat map based on poor, intermediate, and high-quality size distributions that correspond with bin definitions as selected by the user.
For instance, a sample with a single, narrow peak at a size that corresponds to the analyte could be classified as high quality and permitted to continue to the binding assay with high confidence (Figure 8, red wells).
An adjoining sample showing a widened monomeric peak, which indicates some oligomers and possibly low levels of additional particulates tens of nanometers in size, could be classified as intermediate quality and permitted to continue in the process with a warning flag to increase confidence in results (Figure 8, blue wells).
It can be assumed that a sample with considerable particulate content in the micron-size range may be either contaminated or very susceptible to aggregation and thus prevented from proceeding to the binding assay (Figure 8, black wells).
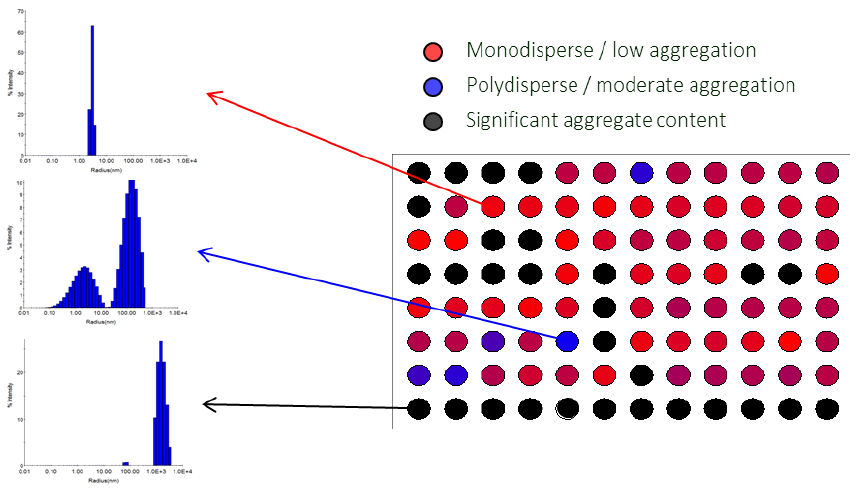
Figure 8. Visualization of protein quality via heat map in DYNAMICS. Total data acquisition time for 96 wells was < 45 minutes. Data courtesy of Sabin Vaccine Institute and Texas Children’s Hospital Center at Baylor College of Medicine. Image Credit: Waters | Wyatt Technology
Additional benefits
Even more beneficial, DLS spontaneously calculates diffusion coefficients, which are useful for evaluating the effects of mass transfer: the mass-transfer-limited reaction rate in SPR is km=0.98(D⁄h)2⁄3(f⁄bx)1⁄3, and the diffusion layer thickness is d=D⁄km, where D is the diffusion coefficient, h and b are the height and width of the SPR flow cell, respectively, x is the distance from the flow cell entrance, and f is the flow rate1.
Yet another unique characteristic of the DynaPro Plate Reader is its built-in, high-magnification camera which takes pictures of each well after taking a DLS measurement. These images, stored and displayed with the associated DLS data, are particularly useful for diagnostics.
A review of the images helps explain why the black-classified data in Figure 8 looks bad. It can help determine, for example, whether the sample has precipitated or whether the well was inadvertently not loaded alongside. Figure 9 displays further examples of poor data sources identified by camera images.
Lastly, the same microwell plates used in the DynaPro can be transferred to a spectroscopic plate reader for further content and quality verification.
Sensitivity
Every tool and approach comes with certain limitations regarding its sensitivity. The lower limit of robust detection for the DynaPro is 0.125 mg/mL lysozyme (M = 14.4 kDa). As the intensity of light scattered by macromolecules corresponds with the molar mass, sensitivity inversely correlates with molar mass, resulting in a lower limit of 0.0125 mg/mL of 150 kDa IgG. Sensitivity to aggregates similarly operates, i.e., a 100 nm Rh aggregate of around 5000 IgG monomers will be indicated at a concentration of ~ 2 ng/mL.
Even if the primary sample concentration is under the limit of detection, DLS remains a helpful test of solution quality as it indicates with superb sensitivity the ‘nanocrud’ content – sub-micron particulates and large protein aggregates that are harmful for the binding analysis and microfluidic system. The same analysis should additionally be utilized to evaluate dilution buffers used in SPR to generate a series of ligand concentrations.
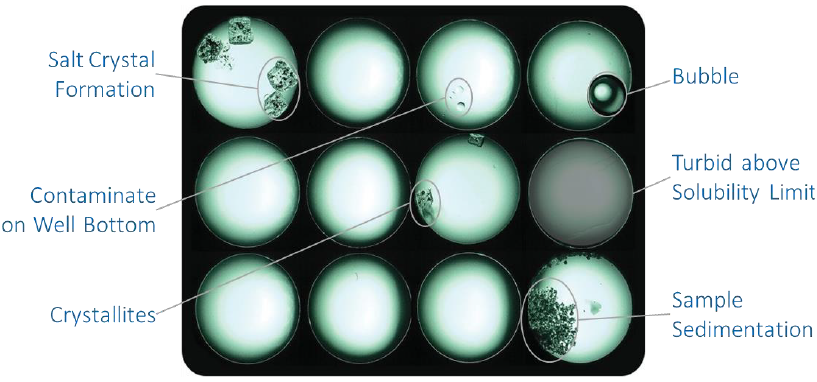
Figure 9. The DynaPro's on-board camera helps identify wells containing clean solution and those where sample has precipitated or otherwise can be expected to provide poor data quality. Image Credit: Waters | Wyatt Technology
Conclusions
Selecting candidate molecules with the highest therapeutic potential and patient benefit depends on a reliable target binding screen, as carried out with SPR or BLI. For this, it is essential to ensure the solutions used in the analysis are high quality. Poor-quality samples negatively affect data quality and have the potential to foul flow cells and microfluidic channels.
High-throughput dynamic light scattering with the DynaPro Plate Reader is easily executed in the screening workflow for classifying solutions as 1) high quality, providing maximal confidence in the interaction analysis; 2) intermediate quality, appropriate for measurement with caution depending on the results; and 3) low quality, unsuitable for analysis and possibly fouling the measurement device.
Including an HT-DLS pre-screen can prevent a lot of the uncertainty and productivity losses linked to variable ligand quality, resulting in binding data that is more reliable and confidence in the final candidate selection. After identifying the most promising candidates, the DynaPro is frequently used in preformulation and candidate developability research to evaluate aggregation, conformational and colloidal stability.2,3
References and further reading
- Karlsson, R., Roos, H., Fägerstam, L. & Persson, B. Kinetic and Concentration Analysis Using BIA Technology. Methods 6, 99–110 (1994).
- Saito, S. et al. Effects of ionic strength and sugars on the aggregation propensity of monoclonal antibodies: influence of colloidal and conformational stabilities. Pharm. Res. 30, 1263–1280 (2013).
- I. Razinkov, V., J. Treuheit, M. & W. Becker, G. Methods of High Throughput Biophysical Characterization in Biopharmaceutical Development. Curr. Drug Discov. Technol. 10, 59–70 (2013).
About Wyatt

Wyatt Technology Corporation develops instrumentation, software and techniques for the characterization of macromolecules and nanoparticles, in solution, based on light scattering and related technologies. The physical properties determined by Wyatt’s products include absolute molar mass of proteins, polymers and other macromolecules; size and charge (zeta potential); protein-protein and other biomolecular interactions; composition of conjugated proteins and co-polymers; and macromolecular conformation.
Products and services
Wyatt’s product line includes instruments and software for:
- on-line multi-angle light scattering (MALS), used in conjunction with size-exclusion chromatography to quantify absolute molar mass, size, conformation, conjugation and aggregation
- traditional (cuvette-based) and high-throughput (microwell plate-based) dynamic light scattering (DLS) to determine size (radius) and size distributions, protein melting temperature and stability-indicating parameters
- electrophoretic mobility (PALS) to determine molecular charge/zeta potential
- composition-gradient light scattering for label-free analysis of biomolecular interactions
- field-flow fractionation for separation of macromolecules and nanoparticles from 1-1000 nm, used in conjunction with on-line light scattering and other detection technologies to quantify molar mass and size
Wyatt also offers, on a limited basis, sample analysis services utilizing its unique technologies.
Sponsored Content Policy: News-Medical.net publishes articles and related content that may be derived from sources where we have existing commercial relationships, provided such content adds value to the core editorial ethos of News-Medical.Net which is to educate and inform site visitors interested in medical research, science, medical devices and treatments.