Messenger RNA (mRNA) holds great potential as a therapeutic agent. To date, Wyatt Technology provides the only comprehensive solution for high-resolution LNP size and payload distribution analysis, combining FFF-MALS for separation and detection with a dedicated LNP analysis module.1
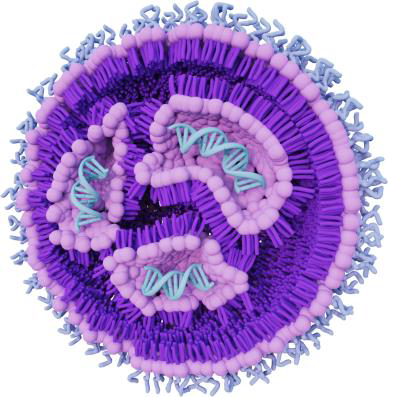
Image Credit: Waters | Wyatt Technology
LNP–mRNA drug products are produced by mixing the nucleic acid drug substance with various lipid components, such as phospholipids, cholesterol, PEG–lipids and ionizable lipids, resulting in a polydisperse drug product with particles ranging in size and nucleic acid content.
As a result, the development, manufacture and quality control of safe, stable and effective LNP–mRNA therapeutics necessitate quantifying multiple attributes, such as LNP–mRNA size-distribution, drug product stability and mRNA integrity and concentration.
Comprehensive quality attribute determination for LNP–mRNA therapeutics usually requires several techniques, including indirect RiboGreen dye-binding assays, particle tracking analysis, cryo–electron microscopy, mass spectrometry and dynamic light scattering (DLS). These methods can be labor-intensive or require highly specialized training.
The study discussed in this article demonstrates how field-flow fractionation together with multi-angle light scattering (FFF–MALS) may be employed for high-resolution multi-attribute quantification (MAQ) of two pioneering mRNA vaccines against COVID-19.2,3
FFF–MALS analysis physically separates LNP–mRNAs by size. Following this separation, the method directly measures multiple attributes by combined MALS, differential refractive index (dRI) and UV absorbance detection.4,5,6 In spite of the similar particle size range for the two vaccine samples, notable variances in particle size and concentration distributions are measured, as well as in mRNA drug dispersion through the LNPs.
Materials and reagents
Bivalent Comirnaty™ (Pfizer-BioNTech) and Spikevax™ (Moderna™) COVID-19 vaccines were thawed and moved from the sealed vaccine vials with sterile syringes and needles before measurement. Samples were then stored and handled following the manufacturers’ guidelines during the various experiments.
Dynamic light scattering
Batch DLS measurements were performed on a DynaPro™ NanoStar™ DLS instrument at 25 °C. All samples were diluted 100-fold in phosphate-buffered saline (PBS) and loaded into a quartz cuvette. Data analysis was carried out with DYNAMICS™ software. The uncertainties reported in this study are the standard deviations from 3 to 6 duplicate measurements.
Field-flow fractionation with UV–MALS–dRI detection
FFF separation was performed using neat samples with an optimized separation method for LNP–mRNAs on an Eclipse™ FFF instrument with a 350 µm fixed-height short channel linked to an HPLC pump and autosampler.
PBS was utilized as the mobile phase and a DAWN™ MALS instrument, Optilab™ differential refractometer and UV detector set to 260 nm wavelength were employed for online detection. The FFF system was controlled by VISION™ software. The uncertainties reported were set as the standard deviations from triplicate measurements.
Data acquisition and analysis were carried out using the ASTRA™ software. The LNPs are large enough to both absorb and scatter 260 nm UV light. Empty LNP samples with the same FFF method as the vaccines were also measured to correct for UV scattering and obtain accurate concentrations from the measured 260 nm UV absorbance data.
Empty LNP samples were prepared with lipid concentrations and compositions in line with the vaccine manufacturer's specifications. The results were used to produce experimentally derived UV scattering correction profiles using the ASTRA LNP Analysis Module software, in accordance with the “Lipid Nanoparticle Payload Analysis” Guidance Manual embedded within the ASTRA software.
Publicly available sequence data for BNT162b2 and mRNA–1273 were used to calculate the expected molar masses of the mRNA drug substances to determine the average number of mRNA molecules per LNP.7,8
Results
To demonstrate LNP–mRNA MAQ by FFF–MALS, the size, particle concentration, molar mass, and mRNA drug substance distributions of the Comirnaty and Spikevax bivalent vaccines against the original virus that causes COVID-19, as well as the Omicron variants BA.4 and BA.5, were characterized.
DLS screening
First, batch DLS measurements were performed to quickly gain an outline of the size distributions and composition of both samples. Batch DLS instruments such as the DynaPro™ Plate Reader, ZetaStar™ instrument, or NanoStar instrument are perfect solutions for rapid, walk-up measurements or automated high-throughput screening of LNP–mRNA samples, formulation, evaluating manufacturing, storage conditions, and freeze-thaw stability.9,10
Using batch DLS, the Spikevax sample appeared to contain larger particles than the Comirnaty sample. In particular, the autocorrelation function (ACF) evaluated for the Spikevax sample decayed slower than the Comirnaty sample (see Figure 1, top), and fitting the ACFs with a standard cumulants model produced an average hydrodynamic radius (Rh) for the Spikevax sample twice that of the Comirnaty sample.
In contrast, the DLS polydispersity was equal for the two samples (see Table 1). While this analysis technique can be helpful for fast screening and flagging samples that fall outside of specification, a cumulants model cannot capture in-depth size distribution information for highly polydisperse samples. The PDI index generated by DLS measurements should be treated as a semi-qualitative assessment. Both LNP formulations show a PDI above 0.2, indicating a polydisperse sample. However, the absolute value cannot be used to quantitatively determine if one is more polydisperse than the other.
Additional refinement using regularization analysis suggested that the samples consisted of two populations: small particles with radii of around 15 to 30 nm and large particles with radii up to around 100 to 200 nm (see Figure 1, bottom).
While DLS cannot directly measure the relative quantities of different particles, the DYNAMICS software can approximate a coarse-grained % mass distribution based on the regularization results, as shown in Figure 1 (bottom).
The low-resolution distribution suggested that the smaller particles accounted for around 95 % mass for the Comirnaty sample and around 80 % for the Spikevax sample (see Table 1).
Therefore, regularization analysis revealed that these two products differed in both the main species size and the size and content of larger particles.
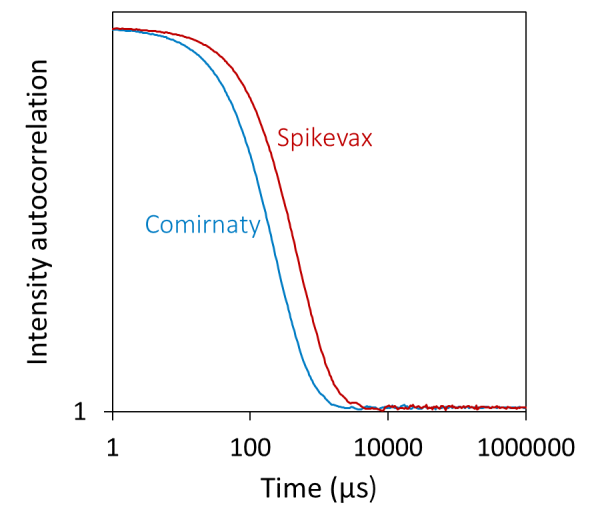
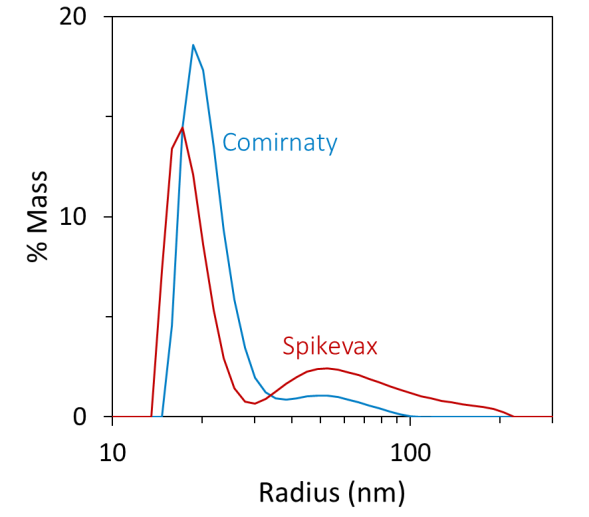
Figure 1. Batch DLS autocorrelation functions (top) and the corresponding size distributions from regularization analysis (bottom) of the Spikevax (red) and Comirnaty (blue) bivalent LNP-mRNA COVID-19 vaccines. Image Credit: Waters | Wyatt Technology
Table 1. Batch DLS results for the Spikevax and Comirnaty bivalent LNP-mRNA COVID-19 vaccines. Source: Waters | Wyatt Technology
| |
|
|
Comirnaty |
Spikevax |
| Cumulants |
Rh (nm) |
38.4 ± 1.1 |
75.4 ± 1.2 |
| DLS PDI |
0.26 ± 0.02 |
0.24 ± 0.02 |
| Regularization |
Main
species |
Rh (nm) |
25.0 ± 3.8 |
38.9 ± 16.7 |
| DLS PDI |
0.37 ± 0.14 |
0.37 ± 0.17 |
| % Mass |
95 ± 12 % |
81 ± 8 % |
Large
species |
Rh (nm) |
62 ± 32 |
183 ± 91 |
| DLS PDI |
0.174 ± 0.004 |
0.27 ± 0.14 |
| All values are average ± standard deviation of 3-6 replicate measurements. |
High-resolution MAQ by FFF–MALS
Physical separation via FFF coupled with multiple detectors was required to reveal the samples' high-resolution size and mass distributions.
The FFF method physically separated the mRNA–LNPs in both samples by size, and the online UV, MALS, and dRI detectors enabled concurrent quantitation of size, molar mass, and payload distribution.
Size distribution
FFF–MALS revealed noteworthy variances in size distribution for the two samples that were not evident using batch DLS alone. Figure 2 displays the FFF fractograms for each sample, overlaid with the geometric radius determined using MALS.
Both samples are polydisperse, as expected, with particle size ranging from 20 nm to nearly 150 nm geometric radius, which is in agreement with the batch DLS screening results.
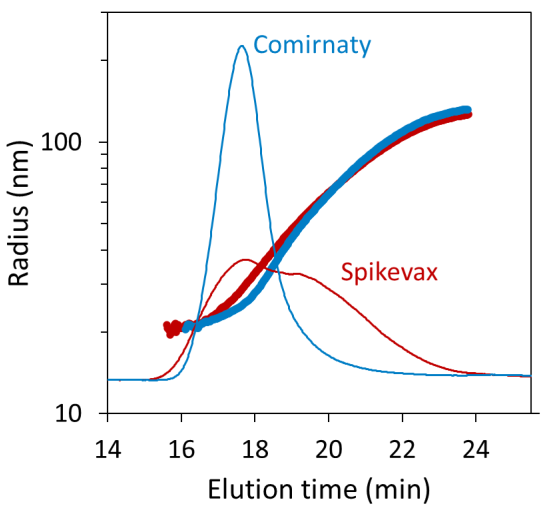
Figure 2. Size distributions for the Comirnaty (blue) and Spikevax (red) samples measured by FFF-MALS, overlaid on the dRI fractograms. Image Credit: Waters | Wyatt Technology
FFF–UV–MALS–dRI enabled greater in-depth quantitation of size distribution within a single polydisperse peak. For example, inspection of the differential weight fraction as a function of size, as shown in Figure 3, revealed greater differences between the samples that were not resolvable using batch measurements alone.
Both samples contained a species with a mean radius of about 25 nm, as well as significant polydispersity. Overall, the Spikevax sample contained a greater weight fraction of large particles than the Comirnaty sample, with 50 % (w/w) of the Spikevax particles exhibiting a radius > 45 nm compared with 12 % (w/w) of the Comirnaty particles.
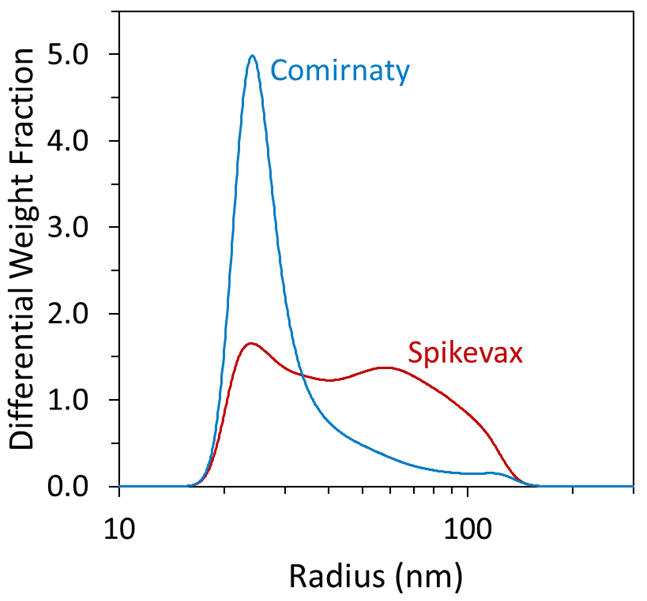
Figure 3. The differential weight fraction from FFF-MALS enables high-precision analysis of the LNP-mRNA size distribution. Image Credit: Waters | Wyatt Technology
Molar mass and composition
The LNP–mRNA molar mass ranged from around 10 MDa to 1 GDa, with a weight-average molar mass (Mw) of 95.4 ± 2.3 MDa and 269.8 ± 5.1 MDa for Comirnaty and Spikevax, respectively. This reflects the greater weight fraction of large particles in the latter sample.
The experiment also provided the molar mass distributions of the mRNA and lipid components, as shown in Figure 4. Unlike batch DLS measurements, FFF–MALS can also measure the true dispersity (Đ, formerly polydispersity index), defined as the ratio of weight-average and number-average molar mass (Mw/Mn).
The Spikevax sample had 2-fold higher dispersity (Mw/Mn = 5.01 ± 0.11) than the Comirnaty sample (Mw/Mn = 2.58 ± 0.08). However, cumulant analysis of batch DLS data failed to capture this pronounced difference between the two samples, as shown in Table 1.
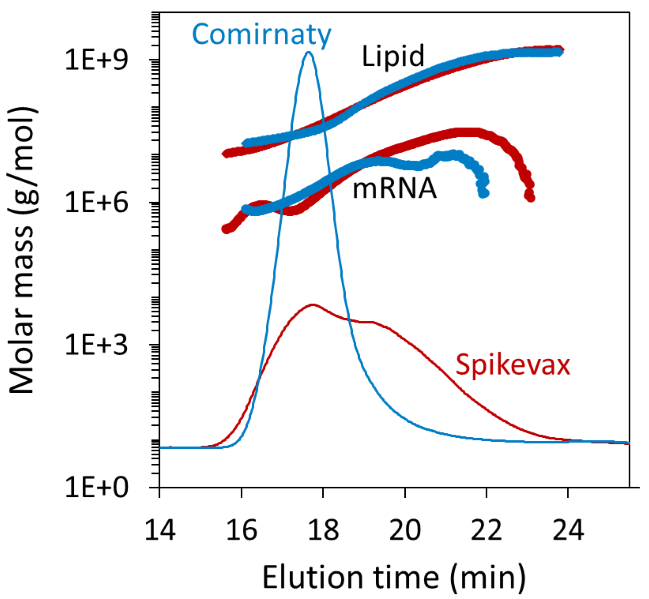
Figure 4. Measured mRNA and lipid molar masses from FFF-MALS, overlaid on the dRI fractograms. Image Credit: Waters | Wyatt Technology
Integration of the dRI and UV fractogram signals produced a total mRNA and lipid concentration for each product. Using this, 0.106 ± 0.002 mg/mL mRNA for Comirnaty and 0.086 ± 0.001 mg/mL mRNA for Spikevax was measured, in excellent agreement with the 0.1 mg/mL specified by the manufacturer.11,12
These calculated concentrations correspond to mRNA drug substance doses of 31.8 ± 0.5 mg/dose and 43.1 ± 0.8 mg/dose for Comirnaty and Spikevax, respectively, in good agreement with the manufacturers’ product information (30 mg/dose and 50 mg/dose, respectively).11,12
Simultaneously, a total lipid concentration of 2.06 ± 0.02 mg/mL and 1.97 ± 0.01 mg/mL was quantified for Comirnaty and Spikevax, respectively, in good agreement with the specifications of the manufacturer (2.5 mg/mL and 2.0 mg/mL, respectively).11,12
The small difference may be due to non-optimized extinction coefficients or dn/dc values employed for the analysis.13 When possible, samples of the free mRNA drug substance will be used to experimentally deduce these constants with the analyses built into the ASTRA software to further improve accuracy.
Size-based payload distribution
FFF–MALS enables high-resolution mRNA payload analysis of intact LNP–mRNA drug product. Conventional measurements can only estimate the distribution of mRNA as a function of LNP size by fractionating the sample by collecting sections of different sizes, breaking the LNPs, and quantifying the quantity of lipid and mRNA separately for each section.
To date, Wyatt Technology provides the only comprehensive solution for high-resolution LNP size and payload distribution. This not only involves FFF-MALS for separation and detection, but also includes the fit-for-purpose LNP analysis module that makes it easy for scientists to analyze their data quickly and consistently, rather than manually calculating their results.
On average, the mRNA drug substance accounted for 4.9 ± 0.1 % w/w and 4.2 ± 0.1 % w/w of the Comirnaty and Spikevax samples, respectively, in agreement with the 4 to 5 % (w/w) specified by the manufacturers.
However, FFF–MALS revealed that the mRNA–lipid ratio was not constant throughout the LNP size distribution. Despite the weight fraction of mRNA never exceeding 10 % of the total particle mass, certain LNP sizes appeared to contain a higher weight fraction of mRNA than others for each sample.
Particles of the Comirnaty sample with a radius < 40 nm had a higher mRNA weight fraction than the corresponding particles in the Spikevax sample, while the larger Spikevax sample particles had a higher mRNA weight fraction compared with the Comirnaty sample, as shown in Figure 5.
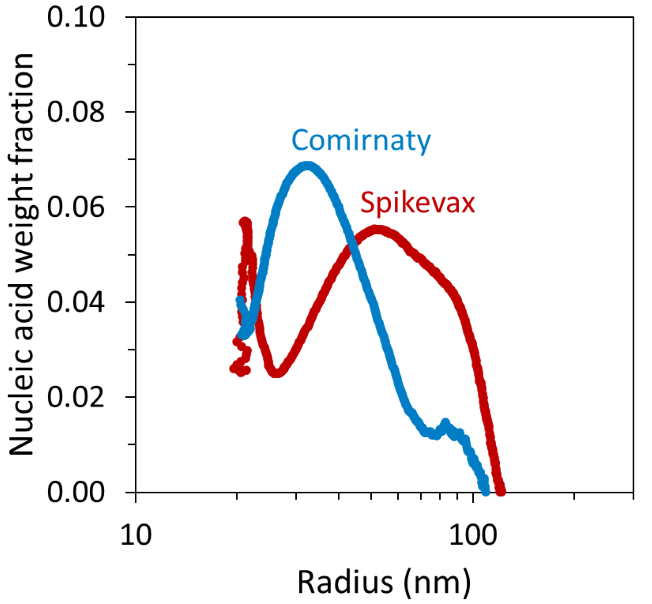
Figure 5. FFF-MALS can be used to measure the mRNA weight fraction as a function of LNP size. Image Credit: Waters | Wyatt Technology
Comparison of the measured mRNA weight-average molar mass and the molar mass of the individual mRNA molecules in each vaccine enabled the ASTRA software to calculate the average number of mRNA per LNP as a function of LNP size, as shown in Figure 6.7,8
It was found that particles with ∼20 nm radius contained a similar mRNA number in both vaccines. In contrast, the ∼25-50 nm Comirnaty particles had more mRNA molecules per LNP than the corresponding Spikevax particles.
The results also suggested that particles with a radius > 50 nm contained a significantly higher nucleic acid number in the Spikevax sample. This variance was reflected by the average nucleic acid number across the whole fractogram peak of 1.79 ± 0.34 and 7.50 ± 0.66 for the Comirnaty and Spikevax sample, respectively.
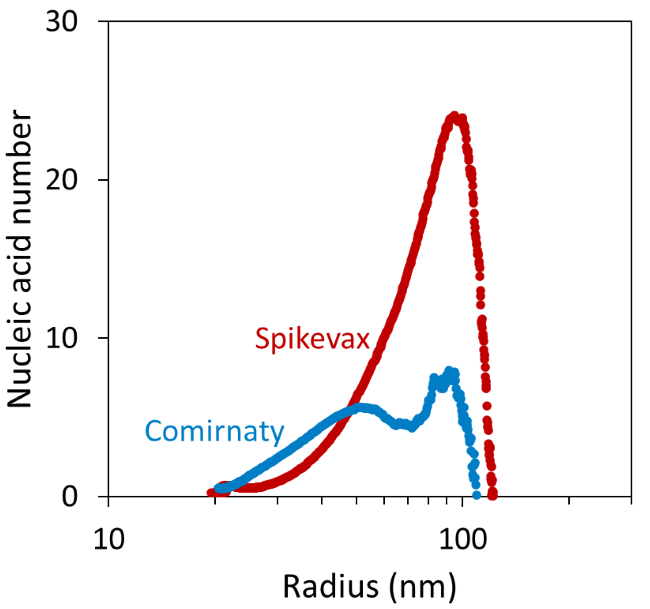
Figure 6. Average number of mRNA per LNP as a function of LNP size. Image Credit: Waters | Wyatt Technology
While the Spikevax samples appeared to exhibit more mRNA per LNP, it should be noted that the largest particles with high nucleic acid numbers only constitute a small fraction of the total population.
Utilizing the combined FFF–UV–MALS–dRI data, the particle concentration as a function of size was quantified and compared to the mRNA number, as shown in Figure 7. This revealed that the very large particles in both samples accounted for < 1 % of the total particles within the sample.
Understanding these distributions can help scientists identify and enrich LNP–mRNA with a desired payload and size content for optimal delivery or therapeutic effect.
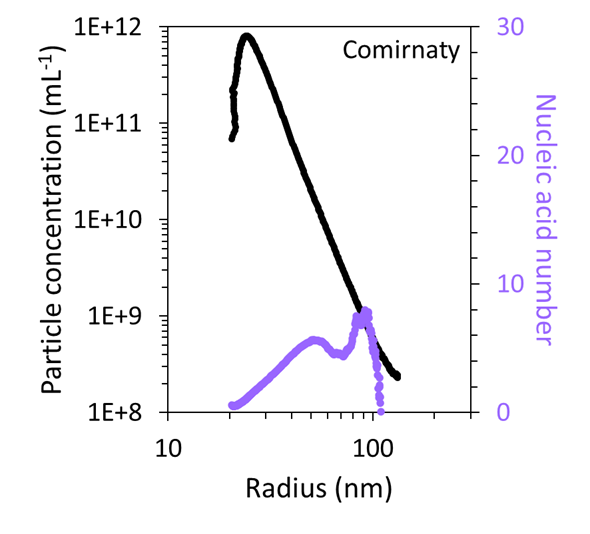
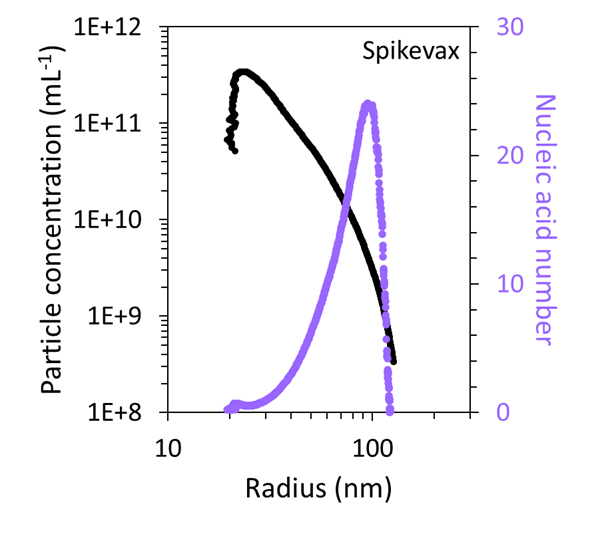
Figure 7. FFF-MALS can quantify the number and concentration of particles with a specific size and mRNA content in the Comirnaty (top) and Spikevax (bottom) samples. Image Credit: Waters | Wyatt Technology
Conclusions
The study presented here demonstrates that FFF–MALS can deliver multi-attribute LNP–mRNA therapeutics quantification. The method is 21 CFR Part 11 compliant, automatable, does not require calibration curves for accurate quantification, and has been validated against conventional offline measurements.13
FFF–MALS exceeds the capabilities of laborious, low-resolution methods such as RiboGreen assays and particle tracking analysis. In this study, a single FFF–MALS experiment not only quantified the average quality attributes of an LNP–mRNA sample but also provided high-resolution insights into its lipid and mRNA subcomponents and how they were distributed through the particles within the sample.
The Comirnaty and Spikevax samples characterized in this study displayed clear differences in high-resolution particle size and concentration distributions, as well as mRNA drug substance distribution across the LNPs.
Data of this sort is crucial for understanding structure-activity relationships and can be employed to rationally optimize the formulation, dosing, and in vivo efficacy of LNP-mRNA therapeutics.
Acknowledgments
Produced from materials originally authored by Martin Kurnik, Ph.D., from Wyatt Technology, LLC.
References and further reading
- Hou, X., et al. (2021). Lipid nanoparticles for mRNA delivery. Nat. Rev. Mater., 6(12), pp.1078-1094.
- Corbett, KS., et al. (2020). SARS-CoV-2 mRNA vaccine design enabled by prototype pathogen preparedness. Nature, 586(7830), pp.567-571.
- Polack, FP., et al. (2020). Safety and Efficacy of the BNT162b2 mRNA Covid-19 Vaccine. N. Engl. J. Med., 383(27), pp.2603-2615.
- Podzimek, S. (2011). Light scattering, size exclusion chromatography and asymmetric flow field flow fractionation: powerful tools for the characterization of polymers, proteins and nanoparticles. John Wiley & Sons, Inc.
- Mildner, R., et al. (2021). Improved multidetector asymmetrical flow field-flow fractionation method for particle sizing and concentration measurements of lipid-based nanocarriers for RNA delivery. Eur. J. Pharm. Biopharm., 163, pp.252–265.
- Parot, J., et al. (2020). Physical characterization of liposomal drug formulations using multi-detector asymmetrical-flow field flow fractionation. J. Control. Release, 320, pp.495–510.
- World Health Organization Messenger RNA encoding the full-length SARS-CoV-2 spike glycoprotein. (2020). Document 11889.
- Jeong, D-E., et al. (2021). Assemblies of putative SARS-CoV2-spikeencoding mRNA sequences for vaccines BNT-162b2 and mRNA-1273. Version 0.21 Beta 04/14/21.
- Zhang, X., Kenrick, S. Measuring size, concentration, and zeta Potential of LNPs with the DynaPro ZetaStar. https://www.wyatt.com/library/application-notes/an6601-measuring-size-concentration-zeta-potential-lnp-with-dynapro-zetastar.html
- Kurnik, M. High-throughput freeze-thaw stability studies with the DynaPro Plate Reader. https://wyattfiles.s3.us-west2.amazonaws.com/literature/app-notes/dls-plate/AN5008- Freeze-thaw-stability-studies-by-HT-DLS.pdf
- COMIRNATY® Full Prescribing Information (12 years of age and older), DO NOT DILUTE, Gray Cap. (2024). https://labeling.pfizer.com/ShowLabeling.aspx?id=16351&f ormat=pdf
- Fact Sheet for Healthcare Providers Administering Vaccine: Emergency Use Authorization of Moderna COVID-19 Vaccine, Bivalent (Original and Omicron BA.4/BA.5). (2024). https://assets.modernatx.com/m/17d17b09d117ca22/origi nal/EUA-COVID-19-Vaccine-Bivalent-Fact-Sheet-forVaccine-Providers-6m.pdf
- Jia, X., et al. (2021). Enabling online determination of the size-dependent RNA content of lipid nanoparticle-based RNA formulations. J. Chromatogr. B Analyt. Technol. Biomed. Life Sci., 1186, pp.123015.
About Wyatt
 With a long history of excellence in scientific instrumentation, Wyatt Technology is the recognized leader in innovative light scattering instruments, accessories, software and services for determining the properties of macromolecules and nanoparticles in solution. Wyatt provides cutting-edge solutions for in-line multi-angle static light scattering (SEC-MALS), field-flow fractionation (FFF-MALS), composition gradients (CG-MALS), high-throughput and traditional dynamic light scattering (DLS), electrophoretic mobility via phase-analysis light scattering (MP-PALS), differential refractometry and differential viscosity. With a staff composed of 20% Ph.D. scientists and many more dedicated and experienced support personnel, Wyatt's aim is to delight the customer with the best products, training, customer support and service available in the industry.
Sponsored Content Policy: News-Medical.net publishes articles and related content that may be derived from sources where we have existing commercial relationships, provided such content adds value to the core editorial ethos of News-Medical.Net which is to educate and inform site visitors interested in medical research, science, medical devices and treatments.