Protein aggregation typically results from conformational or colloidal instability. Conformational stability is the difference in free energy (ΔG) between folded and unfolded states. While not direct assessments of free energy, melting temperature value (Tm) and aggregation temperature (TAgg) can be utilized as qualitative measurements of conformational stability.

Image Credit: ustas7777777/Shutterstock.com
Colloidal stability is calculated by balancing repulsive and attractive intermolecular interactions among protein molecules to sustain the native folded state. Less intermolecular interaction reduces the aggregation propensity. Thus, quantifying the second virial coefficient (B22) is an important screening tool for predicting aggregation propensity.
ARGEN™ is the perfect instrument for assessing quantitative and qualitative characteristics of all classes of biotherapeutics and determining TAgg, B22, molecular weight (Mw), alongside differences in weight, average molecular weight (aggregation) in a variety of thermal, chemical, and mechanical stressors. The following article summarizes the way ARGEN™ is used to calculate the second virial coefficient (B22) and molecular weight (Mw) of a monoclonal antibody.
ARGEN™: Smart and rapid therapeutic biopolymer development
ARGEN is an extremely efficient instrument for rapidly assessing the stability and viability of therapeutic proteins, peptides, and biopolymers. The tool features a multi-stressor testing platform that detects static light scattering and processes intuitive data. These characteristics allow researchers to make biologic formulations up to 16 times more quickly.
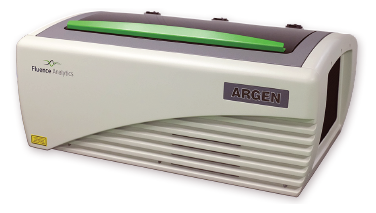
Image Credit: Yokogawa Fluence Analytics
How ARGEN™ works
ARGEN uses fixed angle (90°), SMSLS (simultaneous multiple sample light scattering) technology, which delivers fast, instantaneous, continuous data collection for defining qualitative and quantitative characteristics of target molecules. The instrument has 16 independently controlled sample cells, allowing users to simultaneously set up thermal, chemical, and mechanical stirring stress parameters on all samples. This makes way for an extremely versatile approach to experimental design.
ARGEN™ intuitive control software
The ARGEN control software has an easy-to-use interface for all parts of experimental design and independent control of individual cells for parallel parameter modification and instantaneous data processing.
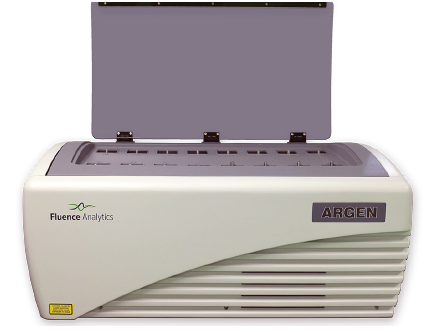
Image Credit: Yokogawa Fluence Analytics
Equations and roadmap for determination of Mw and B22 using static light scattering (90°)
Step 1: Calculating the excess Raleigh ratio at 90°, i(90)
ARGEN determines the intensity of scattered light (90°) from a solution exposed to a vertically polarized laser source. The intensity of the scattered light closely corresponds to the size and concentration of the molecules examined, as characterized by the Zimm equation (Equation 3) and calculated by solving for the excess Rayleigh ratio (Equation 1).
The following equation is used to quantify excessive Rayleigh light scattering intensity “I” at a 90° scattering angle:
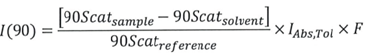 |
Equation 1 |
> 90Scatsolvent represents the scattering intensity of the solvent or buffer alone (minus protein). This figure is spontaneously recorded for every cell each time a “Solvent Baseline” test is undertaken.
> 90Scatreference refers to the scattering intensity of the reference (toluene). This figure is spontaneously recorded for every cell whenever a “Reference Baseline’’ test is undertaken.
> IAbs,Tol refers to the absolute Rayleigh scattering ratio for toluene at the laser wavelength. ARGEN utilizes a laser with λ = 660 nm, thus lAbs,Tol = 1.19E-5 cm-1.
> F is calculated via the tool's optical correction factor. For ARGEN, this figure is F = 0.95.
Step 2: Mw & B22 determination using the Zimm approximation
When calculating the molecular weight of a synthetic or natural polymer, the Zimm approximation is produced at a low concentration when q2 <S2>z << 1. It is possible to use the equation below for a polydisperse polymer population:
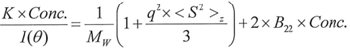 |
Equation 2 |
> Conc. refers to the sample’s concentration (mg/ ml or mg/cm3).
> q2 <S2>z defines the z-average mean square radius of gyration.
> B22 denotes the 2nd Virial Coefficient for the sample dissolved in the solvent.
> K denotes the optical component for vertically polarized light and is calculated via the equation below:
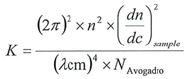 |
Equation 3 |
> n refers to the index of refraction of the pure solvent
> (dn/dc) sample refers to the differential index of refraction increments of a solvent regarding the concentration of sample that has been dissolved in the solvent.
ARGEN spontaneously calculates the value of K upon entry of n and (dn/dc) sample on the experiments page. Within limits of assessing scattering at 90°, the Zimm Equation is reduced to:
 |
Equation 4 |
Or:
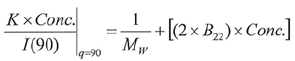
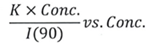
It is possible to produce a Debye plot with these values utilizing Equation 6:
 |
Equation 6 |
The Y-intercept is the same as 1/Mw of the molecule in the solution, and the plot’s slope is the same as twice the virial coefficient (B22) as shown in Figure 3.
Experimental methods
Sample preparation: Solvent & standard (toluene) scattering baseline determination
A 2 ml stock solution of [mAb] = 0.05 mg/ml was composed and then syringe-filtered utilizing a 0.22 µm cellulose acetate filter. All information was gathered at 10 Hz.
After establishing the solvent baseline and standard scattering intensities, a filtered buffer solution was utilized to dilute the stock mAb sample to [mAb] = 0.05 mg/ml. As the scattering intensity between the solvent and mAb solution rose considerably, the neutral density (ND) filter was modified to minimize the scattering of signal saturation.
Afterward, the sample was continually diluted, and scattering intensities were gathered for all dilutions in the series. When the scattering signal was less than 20 % of the maximum, the ND filter was readjusted to heighten signal intensity, as shown in Figure 1 (steps C5 and C6). Normalized scattering intensities for the different dilutions are demonstrated in Figure 2.
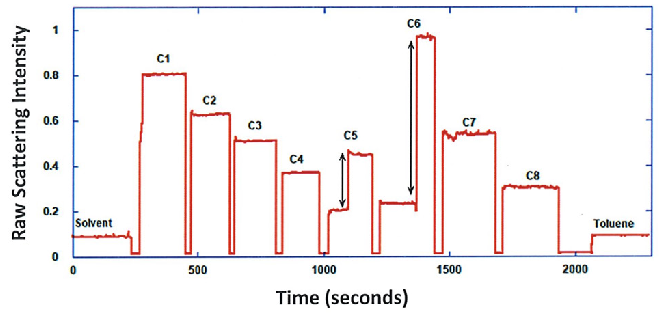
Figure 1. Raw scattering intensities for solvent, mAb dilution series and toluene. Image Credit: Yokogawa Fluence Analytics
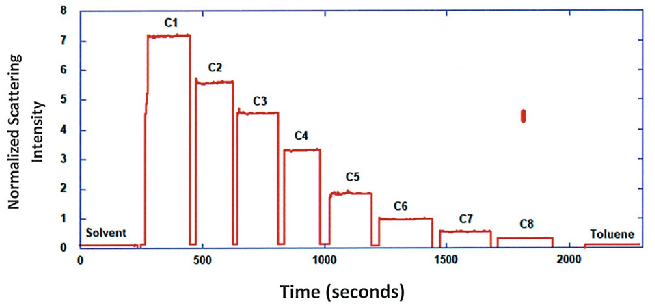
Figure 2. Normalized scattering intensities for solvent, mAb dilution series and toluene. Image Credit: Yokogawa Fluence Analytics
Experimental results
Parameters for Debye plot
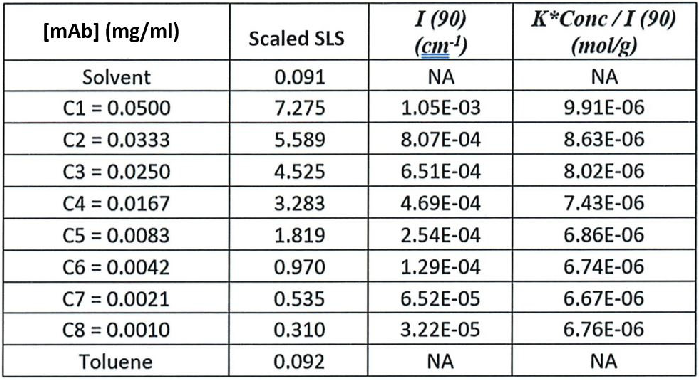
Raw scattering intensities were scaled and normalized to zero neutral density. Scaled scattering intensities (Scaled SLS) for every dilution, solvent, and toluene alongside Rayleigh scattering intensities (I(90)(cm-1))) and values of K*Conc. / I(90) (mol/g) are displayed below in Table 1.
Table 1. Sample concentrations (g/ml), scaled scattering intensities Scaled SLS), Rayleigh scattering intensities (1(90) (cm-1))), and K*Conc./I(90) (mol/g). Source: Yokogawa Fluence Analytics
Debye plot analysis
To calculate K (optical component), the index of refraction for the buffer solution was considered identical to that of pure water, or n = 1.33. Moreover, the established differential index of refraction increment for monoclonal antibodies stands at dn/dc = 0.185 cm3/g with K= 2.089E-7 mol*cm2g-2.
The Y-intercept of the linear fit (regression) suggested that the monoclonal antibody’s molecular weight = 151,600 g/mol, and the second virial coefficient is 3.3E-05 mol*cm3 /g2 as shown in Figure 3. These figures change in accordance to the reference values available in other studies.
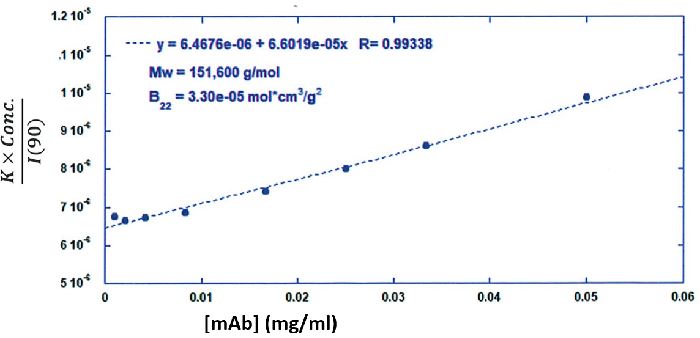
Figure 3. Debye plot for molecular weight and second virial coefficient determination for a mAb. Image Credit: Yokogawa Fluence Analytics
Conclusion
These tests showcase the efficacy of ARGEN for determining molecular weight (Mw) and the second virial coefficient (B22) of a monoclonal antibody. The quantitative and qualitative assessments allowed classification and understanding the proclivity for aggregation in multiple solution conditions. Moreover, ARGEN’s high throughput capacity enables researchers to assess up to 16 samples or conditions at the same time, greatly reducing the time and resources needed for development.
About Yokogawa Fluence Analytics
Yokogawa Fluence Analytics, which was named as a Top 50 global advanced manufacturing startup by CB Insights, provides patented process analytics and control solutions to polymer and biopharmaceutical customers worldwide. Yokogawa Electric Corporation acquired Fluence Analytics in January 2023.
Yokogawa Fluence Analytics is a global leader in real-time polymer reaction monitoring and control, and its industry-leading ACOMP product is the only commercially available smart manufacturing system that continuously monitors and measures polymerization reactions.
The company’s biopharmaceutical product line includes a high-throughput static light scattering instrument called ARGEN. ARGEN can independently measure the stability of biopolymers under thermal, chemical, and mechanical (physical) stress, while also performing shelf-life stability studies at low temperatures.
Sponsored Content Policy: News-Medical.net publishes articles and related content that may be derived from sources where we have existing commercial relationships, provided such content adds value to the core editorial ethos of News-Medical.Net which is to educate and inform site visitors interested in medical research, science, medical devices and treatments.