Biopharmaceutical companies isolate numerous varieties of proteins for usage in experimental medicines and therapeutics. When taken away from their native conditions, proteins lose some stability. Unstable proteins are more susceptible to degradation from primary stress mechanisms, including those of a mechanical and thermal nature (from manufacturing, storage, and transport) and biological nature (stemming from drug delivery).

Image Credit: Billion Photos/Shutterstock.com
A problem for biopharmaceutical companies comes as degraded proteins lead to ineffective and possibly dangerous medicines for their clients. Drug companies work on formulation development to protect against protein degradation.
A formulation is a solution condition in a multidimensional therapeutic trade space. This trade space comprises solvent choice, ionic strength, pH, concentration, and excipients. Biopharmaceutical firms utilize formulation development for each drug to look for the distinct “Goldilocks zone” where the solution is stable in every required condition. As most therapeutic protein formulations are challenging and costly to produce with high yields, biopharmaceutical firms require instruments that deliver quick, excellent protein stability data with low consumption of samples. ARGEN from Yokogawa Fluence Analytics delivers this data and enables independent and instantaneous testing of up to 16 concurrent samples.
ARGEN allows several independent light-scattering experiments, all with their stressor conditions. Furthermore, samples can be introduced and removed from testing without affecting concurrent assessments. Independent testing of every sample enables control and fast characterization of multiple stressor conditions in each study, facilitating the exploration of formulation solution conditions. Scientists can rapidly identify alterations in the relative molecular weight for molecules in solution, allowing them to determine when aggregation begins, degradation, or a phase change more quickly than other technologies.
Since ARGEN’s 16 experiments are completely independent, researchers can concurrently identify aggregation or degradation properties for each sample, regardless of their periods (some taking minutes, while others may require weeks). When a sample is complete, another one can instantly replace it. Moreover, ARGEN analysis methods can independently identify every sample's kinetic aggregation rate (AR) because all data are generated continuously and in real-time. The aggregation or degradation rate provides an important and precise assessment of colloidal stability for proteins and polymer solutions.
This report outlines the usage of ARGEN to identify colloidal stability for bovine serum albumin (BSA) at three different solution pH levels. Formulation development researchers can utilize kinetic data gathered by ARGEN to observe AR variations within solutions containing surface-charged and surface-neutral proteins, i.e., above or below their isoelectric point.
Methodology
Proteins, including BSA, are composed of amino acids and are neutrally-charged naturally amphoteric molecules; accordingly, the solution pH decides the type and distribution of surface charge for every protein molecule. This charge distribution impacts intermolecular and intramolecular interactions among protein molecules. Intermolecular interactions are especially valuable as they directly impact how rapidly a formulation experiences aggregation. This is especially valid for pH levels within and outside the isoelectric point for a molecule. In a study of BSA aggregation behavior at many different pH levels, via fluorescence measurements utilizing an FP-6500 spectrofluorometer (Jasco, Easton, MD), tests confirmed that pH levels near the isoelectric point (4.7) of BSA produced more rapid growth of macromolecular aggregates in comparison to an identical sample surveilled at a pH of 5.7.1 A reason for this change in pathway relates to intermolecular interactions that change as a net surface charge is introduced or eliminated.
To show ARGEN's utility for identifying BSA's colloidal stability, three stock solutions were prepared with different pH levels: 2.75, 4.75, and 6.75. These pH levels were selected to test the stability of the formulation inside and outside the isoelectric point for BSA, where the change in pH greatly affects the overall stability of the sample. The sample was dissolved at 1 mg/mL in a 50-mM phosphate-buffered saline solution in each set of experiments. An aliquot of each sample was subsequently pipetted into all 16 independent ARGEN light-scattering cuvettes. The outermost windows of the cuvettes were disinfected and put into the ARGEN system. Every cuvette was constantly and independently surveilled at 40 °C and 80 °C at isothermal conditions.
Results
As shown previously, changes to the pH of a buffer solution significantly impact the general sample stability and propensity to aggregate when under stress. For instance, the impacts of changing pH are explicitly demonstrated in Figure 1, where the AR for BSA at 55 °C changes at varying pH values. Increasing the pH to 6.75, two units above the isoelectric point, notably decreases the AR, while reducing the pH to 2.75, two units below the isoelectric point, stops aggregation. However, the falling value of molecular weight (norm) and the negative change rate show that the BSA sample kept at pH 2.75 is degrading, probably due to acid hydrolysis.2
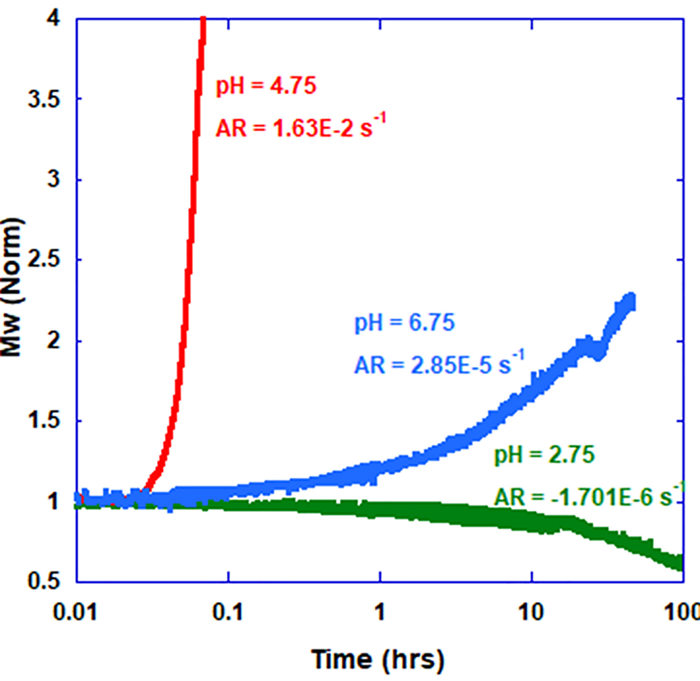
Figure 1. Mw (norm) of BSA at 55 °C for three different pH values. Image Credit: Yokogawa Fluence Analytics
Figure 2 demonstrates an overlay of typical normalized molecular-weight (Mw [norm]) data generated from carrying out multiple isothermal ARGEN assessments for a single formulation. The interpretation of these assessments, as displayed in the figure, shows a visible tendency of more rapid aggregation and greater instability with rising temperatures. This is within the ordinary for BSA and multiple other protein or therapeutic biologics.
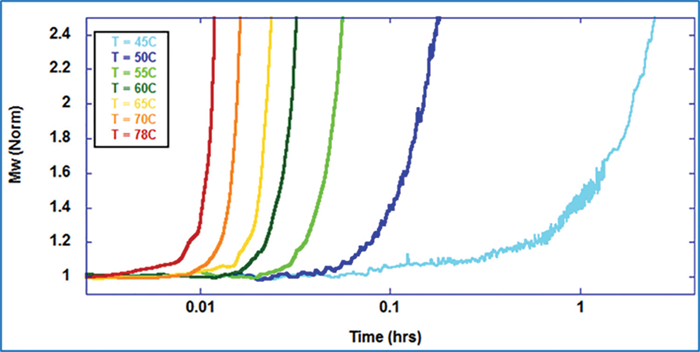
Figure 2. Mw (norm) for BSA pH 4.75 at different temperatures. Image Credit: Yokogawa Fluence Analytics
Figure 3 demonstrates the analysis interface within the ARGEN control software that identifies the AR. In identifying the AR for a sample, users should determine the initial scattering value, as shown by the Mo flag. The initial linear portion of the scattering signal should also be determined and marked with the Ar-1 and Ar-2 flags.
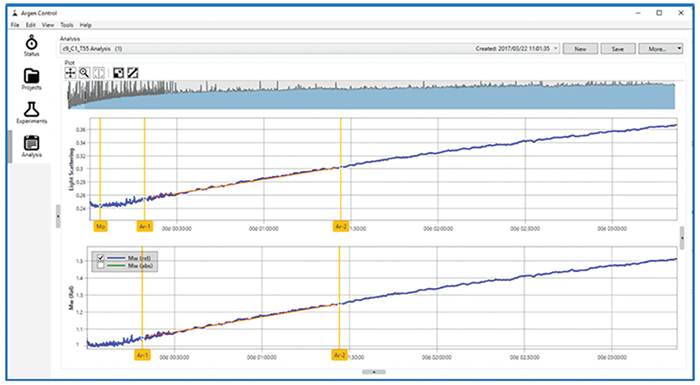
Figure 3. ARGEN analysis interface. Image Credit: Yokogawa Fluence Analytics
ARGEN’s capacity to record kinetic responses of drug formulations to thermal stress over long periods makes it suitable for developing formulations that are resistant to conditions experienced during downstream processing, storage, transportation, and delivery. The data and insight collected from the program’s continuous monitoring techniques can be utilized to contrast the stability of proteins with other formulations. As shown in Ref. 3, generating an Arrhenius plot enables vivid and direct visualization of aggregation rates under many different settings. The Arrhenius plot shows activation energies (ΔEact) and activation energy zones. When Arrhenius plots are produced and utilized to calculate formulation stability, the data illustrates the general sample formulation stability over wide temperature spans, as demonstrated in Figure 4.
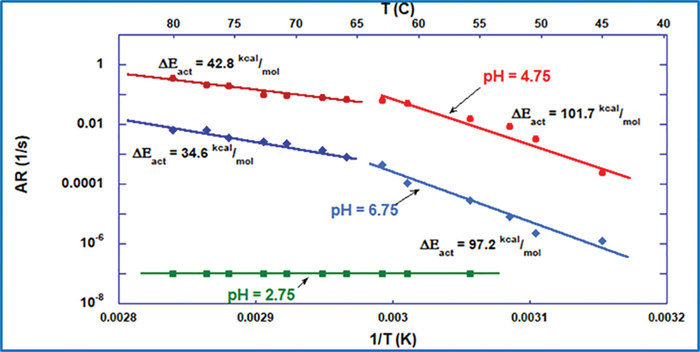
Figure 4. Arrhenius plot comparison of BSA formulations. Image Credit: Yokogawa Fluence Analytics
The Arrhenius plots displayed in Figure 4 are built from measured ARs of temperatures spanning 40 °C to 80 °C at pH levels of 2.75, 4.75, and 6.75. ARs are calculated via ARGEN’s analysis software, which is plotted against the inverse temperature to reveal zones of ΔEact. However, ample data is available on the sample stability for determining the true AR for the formulation as a complete function of temperature. As shown, there are over two orders of magnitude differences in AR at 55 °C between the BSA sample prepared at pH 4.75 and pH 6.75.
The values illustrated in the figure demonstrate that, while there is a significant discrepancy in aggregation propensity, it is not at all reflected in the values of ΔEact. It is commonly known that almost all proteins will quickly start to aggregate if heated above the Tm temperature; thus, defining the aggregation propensity of a sample above or close to the Tm value is largely ineffective for suggesting its stability at regular storage temperatures. However, monitoring the isothermal stability of proteins appropriately under Tm (Tm minus 10 °C), enables researchers to quantify notable variations in AR, as displayed in Table 1. Moreover, as seen in Figure 4, the sample BSA prepared at pH 2.75 did not show an inflection point. According to some, this would indicate that it is the most stable sample, but, as seen only by ARGEN, the low pH degraded the protein.
The AR data in Table 1 demonstrate that BSA at 55 °C in pH 6.75 formulations is two times more stable than in pH 4.75, while the quantified ΔEact only demonstrates a 4.52% discrepancy. If accepted based only on value, the ΔEact for pH 4.75 would suggest that it is slightly more stable than the formulation at pH 6.75.
Table 1. Arrhenius plot analysis statistics. Source: Yokogawa Fluence Analytics
| pH |
AR (1/sec) 55 °C |
ΔEact low-temp. zone (kcal/mol) |
| 6.75 |
2.85E-5 |
97.2 |
| 4.75 |
1.63E-2 |
101.7 |
| 2.75 |
–1.70E-6 |
NA |
Since the AR determines the most stable sample formulation as a function of pH, the next task in optimizing the formulation is to reduce the pH range around pH 6.75 and introduce other formulation variables, such as ionic strength and stabilizers (e.g., arginine, sucrose, etc.). ARGEN allows for rapid stability assessment under these different conditions, permitting the identification of optimum formulations.
Conclusion
ARGEN can bolster and guide novel and existing formulation development research, not only for BSA but also for numerous other biologic molecules.
Additionally, ARGEN can be utilized orthogonally or in place of fluorescence approaches to identify colloidal stability for biologic formulations. Its capacity to identify aggregation rates enables direct and quantitative comparisons of protein stability when subjected to various formulation conditions. This is valuable as aggregation mechanisms remain poorly understood and threaten the viability of biopharmaceutical development at the R&D and downstream processing stages.
References and further reading
- Vetri, V.; Librizzi, F. et al. Thermal aggregation of bovine serum albu- min at different pH: comparison with human serum albumin. Eur. Biophys. J. 2007, 36(7), 717–25.
- Estey, T.; Kang, J. et al. BSA degradation under acidic conditions: a model for protein instability during release from PLGA delivery sys- tems. J. Pharm. Sci. 2006 Jul, 95(7), 1626–39.
- https://docs.wixstatic.com/ugd/250f6c_6cda4e5f54a2434b- 8c80e78e452d2b7c.pdf
- Wang, W. and Roberts, C. Aggregation of Therapeutic Proteins. Wiley, 2010.
About Yokogawa Fluence Analytics
Yokogawa Fluence Analytics, which was named as a Top 50 global advanced manufacturing startup by CB Insights, provides patented process analytics and control solutions to polymer and biopharmaceutical customers worldwide. Yokogawa Electric Corporation acquired Fluence Analytics in January 2023.
Yokogawa Fluence Analytics is a global leader in real-time polymer reaction monitoring and control, and its industry-leading ACOMP product is the only commercially available smart manufacturing system that continuously monitors and measures polymerization reactions.
The company’s biopharmaceutical product line includes a high-throughput static light scattering instrument called ARGEN. ARGEN can independently measure the stability of biopolymers under thermal, chemical, and mechanical (physical) stress, while also performing shelf-life stability studies at low temperatures.
Sponsored Content Policy: News-Medical.net publishes articles and related content that may be derived from sources where we have existing commercial relationships, provided such content adds value to the core editorial ethos of News-Medical.Net which is to educate and inform site visitors interested in medical research, science, medical devices and treatments.