A number of DNA and protein detection reagents are available to researchers, which vary in safety, sensitivity, and suitability for downstream applications. Ethidium bromide is chief among DNA binding dyes, with detection limits as low as 0.5 ng1.
Ethidium bromide, or homidium as it is known in the veterinary sciences, was utilized to effectively treat trypanosomiasis in cattle as early as the 1950s, for which the mechanism of action was unknown until recently2.
The dye interferes with trypanosome DNA replication2, as any molecular biologist would have expected. This underscores the mutagenic safety concerns with this and other DNA-binding dye technologies.
Ethidium bromide-agarose gel electrophoresis is still the most common fluorescence-based DNA detection technique since its conception3, while ethidium bromide has fallen out of favor in the treatment of cattle for the aforementioned risks.
Yet, a number of alternative fluorescence-based DNA dyes are available to investigators (See Figure 1 and Table 1). Colorimetric dyes are still the most common for protein and Coomassie Brilliant Blue (CBB) is arguably the most common post-electrophoresis protein-dye.
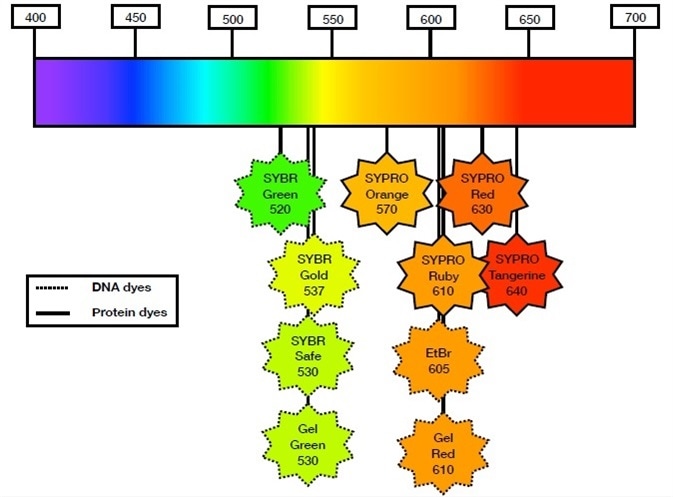
Figure 1. Popular fluorescent dyes for DNA and protein detection within the visible spectrum. SYBR Green, SYBR Gold, SYBR Safe, GelGreen, GelRed, and ethidium bromide (EtBr) are considered the most popular DNA binding dyes for in-gel fluorescence detection. SYPRO Orange, SYPRO Ruby, SYPRO Red, and SYPRO Ruby are the most popular protein binding dyes for in-gel fluorescence detection. SYBR Safe, GelRed, and GelGreen are considered safer alternatives to EtBr. SYBR Gold and SYPRO Ruby are considered the most sensitive dyes for DNA and protein detection, respectively.
Multiple versions of the original protocol exist with reported detection limits which are as low as 3 ng4. Alternatively, silver salt staining can increase the detection limits of protein as low as 0.1 ng. Generally, in routine protocols, silver staining acquires 100x-1000x more sensitivity than CBB5.
Both techniques still either need laborious and time-consuming staining protocols or large volumes of toxic reagents. Fortunately, there are a number of bright fluorescence-based protein dyes available to investigators which have vastly streamlined in-gel protein detection (Table 1).
Analytik Jena has designed their instruments to accommodate both old and new technologies. Crucially, all of their instruments can image gels stained with the most popular fluorescent dyes on the market (Table 1).
Table 1. DNA and Protein Binding Dye Specifications and Filter Requirements.
| DNA Dye |
Peak Excitation (nm) |
Peak Emission (nm) |
AJ Filter Part Number |
| Ethidium Bromide |
300/360 |
590 |
38-0220-01 |
| GelGreen® |
254/488 |
530 |
38-0352-01 |
| GelRed® |
300 |
590 |
38-0220-01 |
| SYBR™ Gold |
300/495 |
537 |
38-0352-01 |
| SYBR™ Green |
254/497 |
520 |
38-0352-01 |
| SYBR™ Safe |
280/502 |
530 |
38-0352-01 |
| Protein Dye |
Peak Excitation (nm) |
Peak Emission (nm) |
AJ Filter Part Number |
| SYPRO® Orange |
300/470 |
570 |
38-0344-01 |
| SYPRO® Red |
300/550 |
630 |
38-0341-01 |
| SYPRO® Ruby |
280/450 |
610 |
38-0344-01 or 38-0220-01 |
| SYPRO® Tangerine |
300/490 |
640 |
38-0341-01 |
These include safer DNA dyes like GelGreen, GelRed, and SYBR safe, in addition to high sensitivity SYPRO Ruby and SYBR Gold for protein and DNA detection, respectively. The diversity of dyes that can be captured with the imagers from Analytik Jena are demonstrated below.
Fluorescence imaging with Analytik Jena’s UVP gelStudio
In order to capture the finest sample details, the UVP GelStudio Series imagers are equipped with a high-performance 5 megapixel camera.
With RGB LED epi-illumination, a UV transilluminator, an easily accessible filter wheel, and an extensive library of emission filters, the UVP GelStudio is able to image any fluorescent dye technology. The flexibility of the UVP GelStudio by imaging is demonstrated below with multiple DNA and protein fluorescent dye technologies.
Methods DNA gels and protein gels
DNA samples were separated on 2 % agarose at 120 volts for at least 45 minutes in 1 X TAE buffer. Biotium 1KB ladder was diluted 1:2 and 20 ul was loaded per well. Before loading DNA, all dyes were homogenized with agarose.
No post-staining or destaining was carried out. The dye concentrations utilized were per the manufacturer’s recommendations. Protein samples were boiled at 85 oC for 5 minutes in Laemlli Buffer and separated on pre-cast NuPage 4-12 % Bis-Tris protein gels.
For SYPRO Ruby detection, samples were diluted 1:10 (from 40 ug to 40 ng) and 1:2 (from 20 ug to 156 ng) for SYPRO Red. SYPRO dyes were employed as per the manufacturer’s recommendations. The rapid protocol was used for SYPRO Ruby.
Visionworks software image capture
Images were captured using the VisionWorks ver. 9.0 software package following the steps below (See Figure 2).
- Navigate to the Devices menu and then the Filters submenu to choose the appropriate emission filter for the application. Up to five preset filter options can be programmed.
- Select excitation light in the Lights pane.
- Select Manual (M) and toggle the arrows to adjust the exposure time in the Camera sub-menu. It is recommended to begin with a 200 ms exposure for most gel applications.
- Select Live View to begin preview. During Live View, navigate to the Lens tab and adjust the Brightness and Focus to your desired level. Once you are satisfied, select Capture in the Camera sub-menu.
- Navigate to the Image tab and select Histogram (Hist) after capturing an image. Auto is recommended. Alternatively, Manual (M) can be selected, and the black, white, and gray levels adjusted to your liking.
The histogram briefly indicates the pixel counts in regions of the white part of the spectrum (right), the black part of the spectrum (left), and in the gray part of the spectrum (middle or everything in between).
As with the majority gel applications, since the gel background is black with fluorescent signal, most of the signal will be in the black regions. This will be indicated by a right skewed histogram (Figure 2, Histogram Adjustment).
Moving the black slider to the right will drop off background in the image and so will sliding the gray slider to the left. Moving the white slider to the left will bring up the white levels (e.g. DNA bands) in addition to any background signal.
Crucially, none of these modifications alter the metadata of the image, so consider this a tool to help you locate and demarcate bands for subsequent analysis or for simple image beautification.
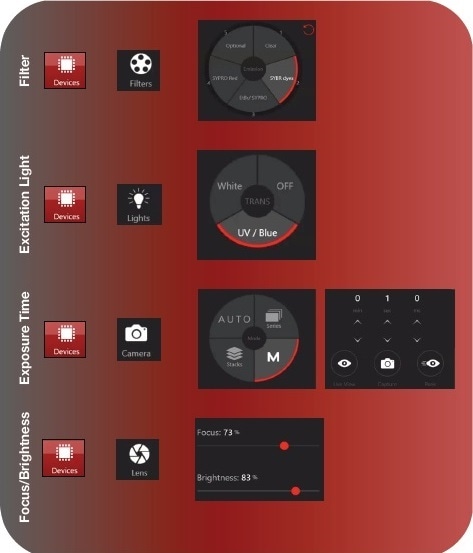
Figure 2a. Capturing a fluorescent gel image with VisionWorks software ver. 9.0. In the DNA or Protein application, navigate to Devices menu and the Filters sub-menu to select the emission filter for your application. Navigate to the Lights sub-menu and select the excitation light source. Both epi and trans illumination are available (trans lighting option shown above). Next, navigate to the Camera sub-menu, select manual capture (M), and adjust the exposure time as determined empirically (continued in Figure 2b).
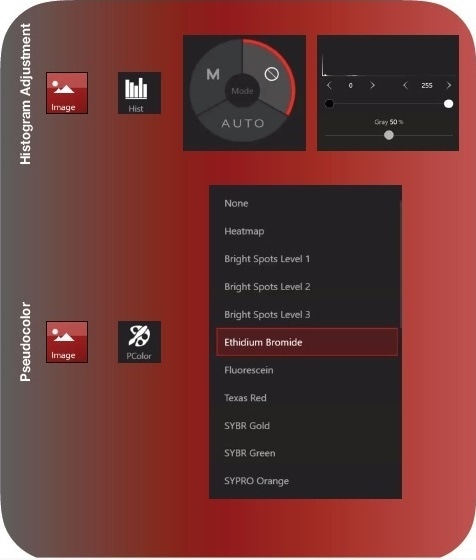
Figure 2b. Starting with 200 ms is recommend. Next, select Live View. During Live View, adjust the Focus and Brightness settings until you can clearly see bands. You may need to increase your exposure time to improve visualization. Once the preview image is optimized, select Capture. You can begin post-processing. You want to adjust the histogram to improve the aesthetics of the image. Moving the black slider increases the black levels. Moving the white slider left, increases the white levels. Adjusting the gray slider will change the midpoint of the scale. The gray slider is especially useful if you use a dye with high background fluorescence. Lastly, navigate to the Devices sub-menu Pcolor to apply a pseudocolor to the image.
Results and conclusion
Some of the most popular dyes employed for fluorescence-based DNA and protein detection are readily captured by the UVP GelStudio imager. In Figure 3, the flexibility of the GelStudio imager is demonstrated by using multiple fluorescent dyes covering the visible spectrum from green to red.
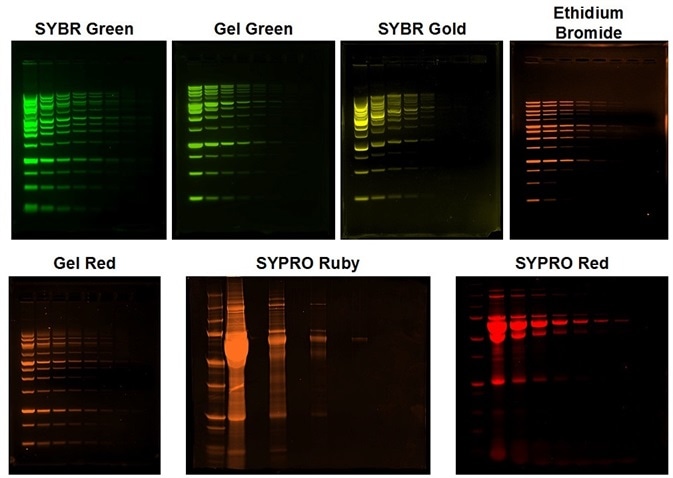
Figure 3. Fluorescent DNA and Protein Gel imaging with the UVP GelStudio. All gels were imaged using a 302 nm UV transilluminator. SYBR Green, Gel Green, and SYBR Gold were imaged using AJ emission filter 38-0352-01. Ethidium bromide and SYPRO Ruby were imaged using AJ Filter 38-0220-01 and SYPRO Ruby were imaged using AJ Filter 38-0341-01. All images were pseudocolored to reflect the emission wavelength. All image processing was completed on Analytik Jena’s VisionWorks Data Acquisition and Analysis software version 9.0.
References and Further Reading
- Ethidium Bromide - US. Available at: https://www.thermofisher.com/us/en/home/life-science/dna-rna-purification-analysis/nucleic-acid-gel-electrophoresis/dna-stains/etbr.html. (Accessed: 1st August 2019)
- Chowdhury, A. R. et al. The Killing of African Trypanosomes by Ethidium Bromide. PLOS Pathogens 6, e1001226 (2010).
- Sharp, P. A., Sugden, B. & Sambrook, J. Detection of two restriction endonuclease activities in Haemophilus parainfluenzae using analytical agarose-ethidium bromide electrophoresis. Biochemistry 12, 3055–3063 (1973).
- Beer, L. A. & Speicher, D. W. Protein Detection in Gels Using Fixation. Curr Protoc Protein Sci CHAPTER 10, Unit-10.5 (2002).
- Winkler, C., Denker, K., Wortelkamp, S. & Sickmann, A. Silver- and Coomassie-staining protocols: Detection limits and compatibility with ESI MS. Electrophoresis 28, 2095–2099 (2007).
About Analytik Jena US
Analytik Jena is a provider of instruments and products in the areas of analytical measuring technology and life science. Its portfolio includes the most modern analytical technology and complete systems for bioanalytical applications in the life science area.
Comprehensive laboratory software management and information systems (LIMS), service offerings, as well as device-specific consumables and disposables, such as reagents or plastic articles, complete the Group’s extensive range of products.
About life science
The Life Science product area demonstrates the biotechnological competence of Analytik Jena AG. We provide a wide product spectrum for automated total, as well as individual solutions for molecular diagnostics. Our products are focused to offer you a quality and the reproducibility of your laboratory results.
This will surely ease your daily work and speed up your work processes in a certain way. All together we support you through the complete process of the lab work. Besides we offer customized solutions and are able to adapt our products to your needs. Automated high-throughput screening systems for the pharmaceutical sector are also part of this segment’s extensive portfolio.
About analytical instrumentation
Analytik Jena has a long tradition in developing high-performance precision analytical systems which dates back to the inventions made by Ernst Abbe and Carl Zeiss. We have grown to become one of the most innovative manufacturers of analytical measuring technology worldwide.
Our business unit Analytical Instrumentation offers excellent competencies in the fields of optical spectroscopy, sum parameters and elemental analysis. Being proud of our core competency we grant all our customers a long-term warranty of 10 years for our high-performance optics.
About lab automation
With more than 25 years of market experience, Analytik Jena with its CyBio® Product Line is a leading provider for high quality liquid handling and automation technologies. In the pharmaceutical and life science industries, our products enjoy the highest reputation for precision, reliability, robustness and simplicity.
Moreover, the Automation Team designs, produces and installs fully automated systems tailored to our clients' application, throughput and capacity requirements. From stand-alone CyBio® Well up to fully customized robotic systems we handle your compounds, biomolecules and cells with great care.
Sponsored Content Policy: News-Medical.net publishes articles and related content that may be derived from sources where we have existing commercial relationships, provided such content adds value to the core editorial ethos of News-Medical.Net which is to educate and inform site visitors interested in medical research, science, medical devices and treatments.