Sponsored Content by SartoriusReviewed by Alex SmithMar 7 2022
T cells are an essential part of the control and execution of the body’s adaptive immune response against cancerous or infected cells.
Their centrality to this process has given rise to ongoing developments in immunotherapies designed to enhance the T cell response against cancer, for example, CAR-T cells, bispecific antibodies and checkpoint inhibitors.
These immunotherapies work by targeting different stages of the T cell activation and differentiation pathways. For example, they may be designed to increase T cell activation, improve the frequency of self-renewing memory cells, or lower levels of T cell exhaustion.
One of the most vital parts of developing novel therapeutics lies in the characterization of function through the use of in vitro assays. The majority of this work – especially in the flow cytometry field – has been undertaken using non-adherent cells or cell monolayers (2D).
There is, however, increasing evidence to support the application of advanced 3D tumor cell cultures, for example, spheroids and organoids. These models better reflect the in vivo scenario, resulting in improved clinical translation.
Conventional and historically employed techniques for measuring T cell response tend to:
- Offer users a bulk measurement of killing (for example, imaging) without providing a more in-depth analysis of effects on cytokine release or cell marker expression
- Necessitate the use of multiple workflows – using different instruments – for quantification of various parameters
- Lack robust physiological relevance to specific in vivo conditions
- Require the use of long, time-consuming workflows, including protocol optimization, fixation and repetitive wash steps
This article outlines a straightforward, robust workflow for measuring T cell response in a spheroid T cell killing assay. This workflow is made possible thanks to the iQue® High-Throughput Screening (HTS) Cytometer and its related suite of validated reagents.
The user has the option of combining one or more iQue® kits to generate the desired outputs. Available kits include iQue® Human T cell Killing, iQue® Human T cell Exhaustion, the iQue® Human T Cell Activation, and iQue® Human T cell Memory Kits.
Screening and profiling studies can be consistently enhanced by combining the power of the iQue® and automated, integrated analysis techniques with immediate pharmacological readouts.
This robust combination of tools allows the in-depth analysis of the impact of novel immunotherapies on T cell response.
Assay concept
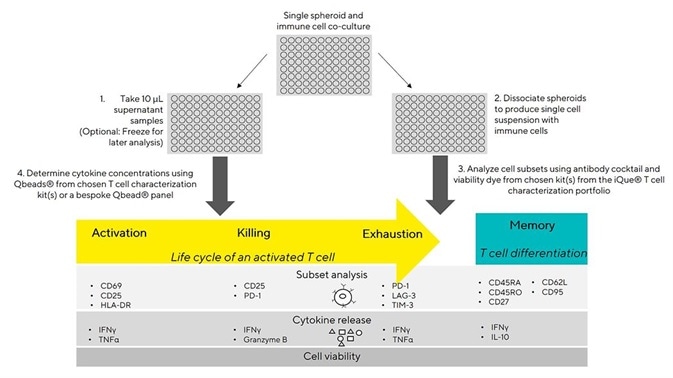
Spheroids are formed in ULA plates before immune cells (PBMCs or T cells) are added. It is possible to acquire a number of 10 µL supernatant samples from a single assay plate, enabling kinetic cytokine quantification.

Figure 1a. Illustration of the iQue® spheroid T cell killing assay principles. Image Credit: Sartorius
Spheroids are dissociated at assay endpoint in order to create a single cell suspension containing immune cells and target cells. Cells and cytokines can be analyzed using the range of iQue® T cell characterization kits (Activation, Killing, Exhaustion and Memory).
Each of these kits features a distinct combination of antibodies - including basic T cell markers allowing users to effectively profile cell surface marker expression.
These antibodies are coupled with 2-plex iQue Qbeads® to quantify secreted cytokine concentration. It is also possible to simultaneously measure cell proliferation (optional) and viability in each well.
Key advantages
This approach offers a number of key benefits, allowing users to perform a range of key analysis types.
- Enable 3D tumor analysis, including evaluation of T cell response to solid tumors via the use of a reproducible, straightforward protocol to facilitate the gentle dissociation of spheroids.
- Interrogate phenotype and function, including investigations into T cell phenotype and function during tumor cell killing via the use of 3D advanced cell models.
- Unlock productivity thanks to a combination of rapid sampling speeds, increased replication, multi-kit analysis capabilities and high-throughput quantification options.
- Streamline data acquisition and remove bottlenecks with a combination of plate-level analysis and novel visualization tools designed to reduce the time required to acquire actionable data.
These advantages are highlighted below via a series of examples.
Enable 3D tumor analysis and interrogate phenotype and function
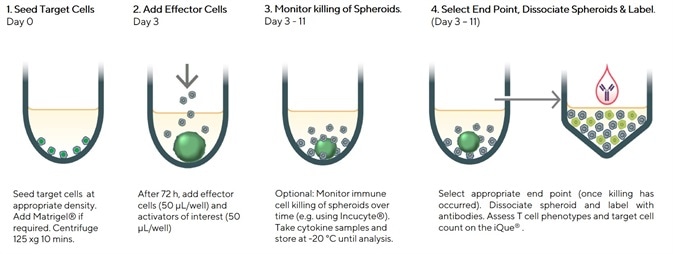
Incucyte® Nuclight green-labeled MDA-MB-231 cells (2.5K/well) were seeded in ULA plates. This was done using 2.5% Matrigel®. Samples were incubated for 72 hours to promote spheroid formation.

Figure 1b. Assay Workflow - Protocol for analysis of T cells in a spheroid killing assay using the iQue®. Image Credit: Sartorius
After incubation, unlabelled PBMCs were added at a 5:1 effector-to-target ratio (E:T). Activation was induced using an ImmunoCult™ Human CD3/CD28/CD2 T Cell Activator.
On days 1, 3 and 7, identical plates were dissociated before T cell phenotypes were analyzed with the iQue® Human T Cell Killing Kit.
The study determined that target cell viability demonstrated a notable decrease from day 1 to day 7 when exposed to the highest concentrations of Immunocult.
Expression of T cell activation and exhaustion markers were observed to increase from day 1 to day 3 before decreasing by day 7. Granzyme B is a protease directly involved in inducing T cell mediated tumor cell death. Its release was found to increase with Immunocult concentration.
It was also noted that BT474 (2.5K/well) spheroids formed 72 hours prior to PBMCs (12.5K/well) and CD3/CD28 Dynabeads being added.

Figure 2a. Quantify cell subsets and cytokine release during T cell killing of tumor spheroids using iQue® advanced flow cytometry. Image Credit: Sartorius

Figure 2b. Investigate T cell function over time with low volume supernatant sampling for kinetic cytokine analysis. Image Credit: Sartorius
Supernatant samples (10 µL) were acquired on days 1, 4 and 8. The analysis of cytokine concentrations was done using iQue Qbeads®. Concentrations of cytokines indicative of T cell activation - IFNγ and TNFα – were found to increase over time and in line with Dynabead density.
It was also noted that the release of Granzyme B protease also increased. This is directly involved in target cell killing by cytotoxic lymphocytes. Production of IL-10 – recognized as a cytokine with links to the rate of T memory cell formation – increased to day 4 then was noted to decrease by day 8.
Unlock productivity
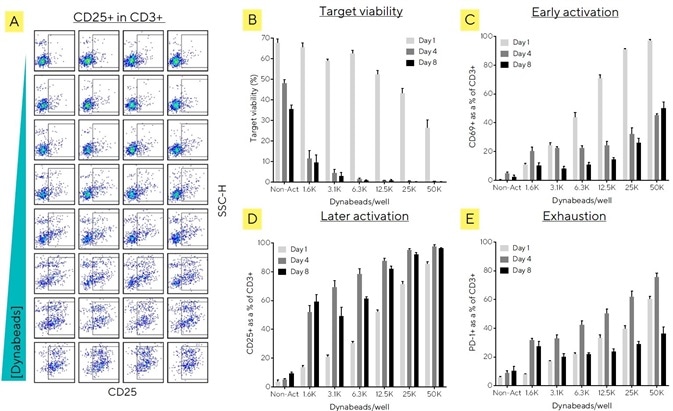
Incucyte® Nuclight green-labeled BT474 (2.5K/well) spheroids formed for a total of 72 hours prior to the addition of PBMCs (12.5K/well) and CD3/CD28 Dynabeads.
Analysis was done on cells from replicate plates on days 1, 4 and 8 via the iQue® Human T Cell Activation, Killing and Exhaustion kits. Figure A shows a plate view plot of CD25+ cells in the live CD3+ population, while Figure B shows target cell viability decreasing over time.
Figure C highlights the expression of early activation marker CD69. This had initially increased on day 1 before decreasing by day 4.
Figure D shows CD25 – a later activation marker expression that was enhanced on days 4 and 8. Figure E highlights the expression of PD-1, an early indicator of T cell exhaustion. This was found to be the greatest on day 4.

Figure 3. Fast run times facilitate broad phenotype analysis using multiple T cell characterization kits. Image Credit: Sartorius
Streamline data acquisition
BT474 spheroids (2.5K/well) were incubated with PBMCs. This was done at a 5:1 effector-to-target ratio (E:T) with activation-induced via CD3/CD28 Dynabeads.

Figure 4. Pre-set gating templates in iQue Forecyt® provide automated phenotyping of T cell subsets. Image Credit: Sartorius
Analysis was done after 24 hours using the iQue® Human T Cell Memory Kit. Figure A shows a plot highlighting gating of Tscm (stem cell memory) and Tte (terminal effector). This was done using the template provided in the kit.
Figure B displays a heat map while Figure C displays concentration-response curves exported directly from the iQue Forecyt® software. These curves clearly show the shift from the Tscm (stem cell memory) early phenotype towards the later stage Tte (terminal effector) phenotype, in line with increasing Dynabead concentration.
It was also noted that this shift was accompanied by a loss in the T cells’ ability to self-renew.
About Sartorius

Sartorius is a leading international pharmaceutical and laboratory equipment supplier. With our innovative products and services, we are helping our customers across the entire globe to implement their complex and quality-critical biomanufacturing and laboratory processes reliably and economically.
The Group companies are united under the roof of Sartorius AG, which is listed on the Frankfurt Stock Exchange and holds the majority stake in Sartorius Stedim Biotech S.A. Quoted on the Paris Stock Exchange, this subgroup is comprised mainly of the Bioprocess Solutions Division.
Innovative Technologies Enable Medical Progress
A growing number of medications are biopharmaceuticals. These are produced using living cells in complex, lengthy and expensive procedures. The Bioprocess Solutions Division provides the essential products and technologies to accomplish this.
In fact, Sartorius has been pioneering and setting the standards for single-use products that are currently used throughout all biopharmaceutical manufacturing processes.
Making Lab Life Easier
Lab work is complex and demanding: Despite repetitive analytical routines, lab staff must perform each step in a highly concentrated and careful way for accurate results.
The Lab Products and Services Division helps lab personnel excel because its products, such as laboratory balances, pipettes and lab consumables, minimize human error, simplify workflows and reduce physical workloads
Sponsored Content Policy: News-Medical.net publishes articles and related content that may be derived from sources where we have existing commercial relationships, provided such content adds value to the core editorial ethos of News-Medical.Net which is to educate and inform site visitors interested in medical research, science, medical devices and treatments.