A key limitation when investigating diseases that affect the human nervous system is the ability to quantify, monitor, and analyze the activity of neuronal cell populations that precisely represent human phenotypes.
These restrictions are the result of the limited access to cells from human patient tissue, along with a lack of purpose-built tools allowing functional measurements of neuronal cells at adequate throughput to enable complete phenotypic characterizations.
With the emergence of cellular reprogramming technologies, there has been a wealth of research focusing on the development of protocols to differentiate human induced pluripotent stem cells (hiPSCs) into several cell populations residing in the brain (such as immunological, glial, neuronal, and more).
This has led to the production of a wide range of neuronal cell models (such as peripheral, glutamatergic, GABAergic, dopaminergic and more), most of which continue to be insufficiently characterized. This signals a need to better comprehend in vitro cellular models and determine ways in which they could be refined.
The Incucyte® S3 Live-Cell Analysis System for Neuroscience applications, technology, and methodology outlined in this white paper was produced to correct these challenges.
That is, to give researchers a range of automated tools as a means to enable the validation, evaluation, and characterization of complex neuronal models.
Assay principle
While the quantification of the morphological characteristics of neurons (such as neurite outgrowth) can offer information about their structure, neuronal activity assays offer a superior and more advanced understanding of how neurons respond to their environment, how they function, and how they form synaptic connections with other neurons.
This white paper outlines an integrated solution for long-term neuronal activity measurements founded on a new neuronal specific, live-cell genetically encoded calcium indicator (GECI) named Incucyte® NeuroBurst Orange and the Incucyte® S3 for Neuroscience.
Along with new analysis tools and system capabilities offered by the Incucyte® S3 Neuronal Activity Analysis Software Module, this system provides automated measurements of calcium oscillations and morphological observation of thousands of functional neurons inside a culture over an extended time period, days, weeks, and months (Figure 1).
This technique gives scientists the ability to better comprehend when and how network connections are created amongst cells in culture, and how the context of the environment (for example media formulations, stromal cells, drug treatments, and more) can modify their behavior.

Figure 1: Assay Workflow. Image Credit: Sartorius
Materials and methods
Incucyte® NeuroBurst transduction
A GECI is encoded by the lentiviral-based reagent Incucyte® NeuroBurst Orange, under the direction of the neuronal specific synapsin promoter.
The transduction protocol for expression of Incucyte® NeuroBurst Orange in astrocyte/neuronal co-cultures is outlined in Figure 2a. Biomatrix was utilized to coat tissue culture plates, astrocytes and neurons were plated in sequence, before the NeuroBurst Orange Reagent (Essen BioScience Cat. No. 4736) was introduced after two days in culture.
The NeuroBurst Orange Reagent was removed on the next day, before anti-proliferative compounds were included to limit glial cell division, and Incucyte® scans were performed to evaluate neuronal activity.
Cell plating methods
Plate coating primary rat co-culture model: 0.1 mg/mL Poly-D-Lysine was used to coat 96-well plates for 20 hours at room temperature. Sterile water was used to wash the plates twice, which were allowed to dry prior to plating.
Plate coating iPSC-derived neurons: 2.2 mg/ml polyethlenimine (PEI, Sigma Cat. No. 408727) in 0.1 M sodium borate solution (Thermo Fisher Ca. No. 2834) were used to coat 96-well plates for 20 hours at room temperature.
PEI was removed the next day, and the wells were washed with sterile water three times (cell culture grade). 100 µl of 3.3 µg/mL laminin was subsequently included to each well and incubated for a minimum of 1 hour at 37 ˚C. Laminin (Sigma Cat. No. L2020) was removed immediately before cell seeding.
Primary rat forebrain neurons: 20,000 rCortical or rForebrain neurons (Essen BioScience Cat. No. 4753) per well were plated in 1 mL NeuroCult™ SM1 Neuronal Supplement (Stemcell Technologies, Cat. No. 05711), Complete Plating Medium (48.5 mL NeuroBasal™ Medium Thermo Fisher Cat. No. 21103-049), and 0.5 mL 100X GlutaMAX™ Supplement (Thermo Fisher Cat. No. 35050061).
After two hours of incubation, rAstrocytes (Essen BioScience Cat. No. 4586) were introduced at a density of 15,000 cells per well. The next day, 15 µl per well of NeuroBurst Orange reagent was introduced.
After 16 to 24 hours, the plating medium was taken away and replaced with Complete Maturation Medium (49 mL BrainPhys™ Neuronal Medium (Stemcell Technologies Cat. No. 05790), 1 mL NeuroCult™ SM1 Neuronal Supplement (Stem Cell Technologies Cat# 05711) including 5-FdU/U. Half of the assay media was replaced every three days throughout the experiment.
iCell® iPSC-derived neurons (Cellular Dynamics Cat. No. R106): 20,000 cells were plated per well in accordance with the media instructions of the manufacturer without pen/strep or laminin. rAstrocytes were added at a density of 15,000 cells per well after two hours of incubation.
The subsequent day, 30 µl per well of NeuroBurst Orange reagent was introduced. A complete media exchange was completed after 16 to 24 hours, including 5-FdU/U. A 50% media exchange was performed every three days throughout the investigation.
Ncardia iPSC-derived neurons (Ncardia): Culture conditions and cell plating were carried out according to the suggestions of the manufacturer unless otherwise stated in particular figure legends. Briefly, 25,000 Peri.4U® (Ncardia Cat. No. Ax-B-HZ02-2M) or 20K CNS.4U® neurons were plated.
After an incubation period of two hours, rAstrocytes were added to cultures of Peri.4U neurons at a density of 15,000 cells per well. CNS.4U neurons did not have rAstrocytes added to them. On the second day, cells were infected with NeuroBurst Orange (Peri.4U - 15 µl per well; CNS.4U - 3 µl per well).
A full media exchange was performed after 16 hours. FdU/U was added to the media exchange for Peri.4U cells, excluding the CNS.4U cells. A 50% media exchange was performed every three days throughout the experiment.
Incucyte® S3 for neuroscience user interface
The user interface of the Incucyte® S3 for Neuroscience is produced to visualize neuronal activity in every well within a 96-well plate. Every scan includes a 30 to 180 second ‘Stare Mode’ recording of the activity of cells at a speed of three frames per second.
Each movie acquired via the ‘Stare Mode’ is translated into a single range image to enable easy viewing (Figure 2b). This image shows the array of intensities that are identified from each cell inside the culture during the selected scan time.
Automated image segmentation tools are employed to find active objects (cells) inside of each well (Figure 2c) utilizing this image. Established on the dynamic fluorescent intensity of each distinct cell, intensity traces are shown for each active cell within the culture (Figure 2d).
Scanning is normally performed once every 24 hours. As illustrated in these sample traces of iPSC-derived iCell® GlutaNeurons (Cellular Dynamics), the activity inside of these cultures can dramatically vary each day with the maturation of the network.
In this example, there is minimal activity on the fourth day, a gradual increase on the seventh day, and highly synchronous activity can be observed on day 12 and day 17.
Once the data has been acquired, multiple automated metrics are determined at each scan time and for each well. This enables easy visualization of dynamic metrics over the total duration of the experiment (Table 1).
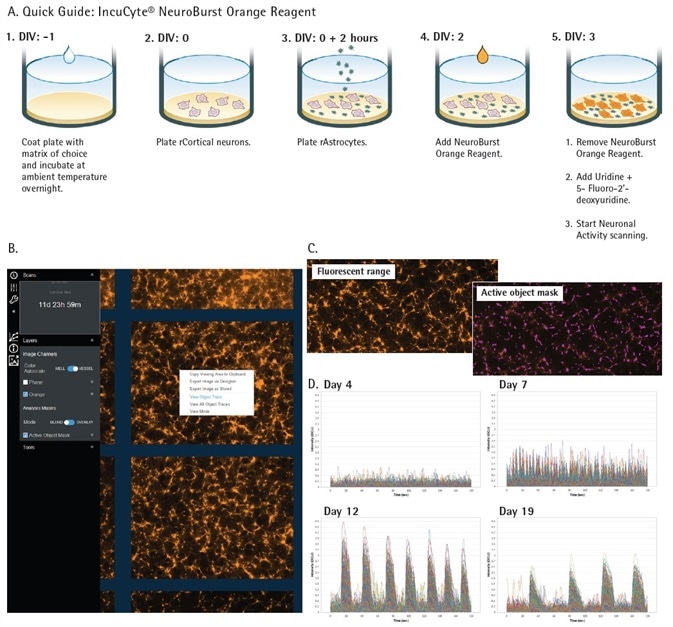
Figure 2. Incucyte® S3 for Neuroscience and Neuronal Activity Application. Quick guide workflow of NeuroBurst Orange infection protocol (A). The Neuronal Activity user interface is capable of displaying object traces, viewing movies, and longitudinal data of neuronal activity from each well (B). Fluorescent range image and automated segmentation mask of each active object represents a snapshot of activity over the complete scan (C). An example of iCell GlutaNeuron calcium traces from each 3 min scan indicate changing neuronal activity (fluorescence intensity) over 17 days in culture (D). Image Credit: Sartorius
Table 1. Neuronal Activity Analysis Metrics. Source: Sartorius
| Metric |
Description |
| Active Object Count (1/image) |
The number of objects (cells/cell clusters) that burst at least once above the Minimum Burst threshold over the total scan time. |
| Mean Intensity (OCU) |
The mean intensity of an object over the total scan time. All objects within the image are calculated individually, then values are averaged. |
| Mean Correlation |
Every object is compared to every other object in the image to generate a value between -1 and 1, with 0 being completely random and 1 being highly synchronized. This is a measure of network connectivity. |
| Mean Burst Duration (sec) |
The duration of each calcium burst over the total scan time is calculated individually, then values are averaged. |
| Mean Burst Rate (1/min) |
The number of calcium bursts over the total scan time divided by the scan time in min. |
| Mean Burst Strength (OCU) |
The area under each calcium burst divided by the duration of that burst is calculated individually. then values are averaged. |
Results
Optimization of Incucyte® NeuroBurst Orange
Primary rat neurons (E18) co-cultured with primary rat astrocytes present a well-validated model for the investigation of neuronal activity. In this investigation, E18 rat forebrain neurons were plated at declining cell densities (5 to 40,000 per well) in co-culture with a set amount of rat astrocytes (15,000 per well).
As presented in Figure 3a, fluorescence intensity inside the range image strongly corresponds with cell density. The greatest amount of activity can be seen at 40,000 neurons per well.
The range image additionally gives the user a qualitative evaluation of toxicity, morphology, and transduction efficiency.
Summary traces of neuronal activity offer a quantitative evaluation of the activity inside of each well. The density of the tested neurons was ideal for the visualization of neuronal activity inside of each scan (Figure 3b) and the identification of active objects through the entire duration of 12 days (Figure 3c).
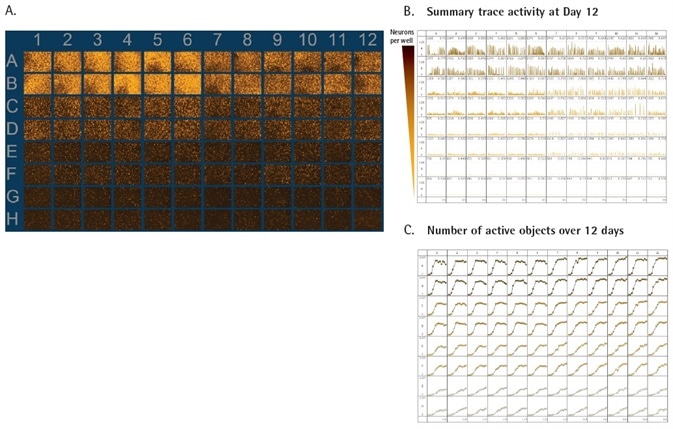
Figure 3. Functional activity of primary neurons. Primary rat forebrain neurons were seeded at 40K (rows A and B), 20K (rows C and D), 10K (rows E and F), and 5K (rows G and H) cells / well. All densities of neurons were plated in a co-culture with primary rat astrocytes seeded at 15K cells/well and transduced with the NeuroBurst Orange Reagent. 96-well vessel view of the range image over the course of the scan provides a snapshot of active wells at each time point (A). Summary traces of fluorescence intensity across all active objects for the 96-well plate at day 12 provide an overview of activity and display metrics of bursting intensity, active object number and mean correlation (B). 96-well throughput with high kinetic reproducibility over 12 days in culture (C). Image Credit: Sartorius
Long term expression of NeuroBurst GECI does not impact functional measurements of neuronal activity
In a live-cell, long-term experiment, it is crucial that the reagents employed for cell analysis do not disturb the functional biology of the culture. This verifies that any observed fluctuations are a consequence of the experimental conditions instead of the reagent utilized to identify them.
To confirm that long term expression of the GECI does not negatively affect synchronicity or activity of iPSC-derived neurons, co-cultures of iCell GlutaNeurons were infected 3 or 21 days following culture initiation to establish if variations in activity could be monitored as a function of length of GECI expression.
No measurable variation in neuronal activity was observed (Figure 4). Acute toxicities related to viral transduction was also not observed given that a careful exploration of ideal viral concentration was carried out (data not shown).
This data shows that the presence of the GECI does not buffer calcium to the degree that an influence on the biology is noted, and that acute toxicities related to viral infection can be mitigated with accurate experimental optimization.
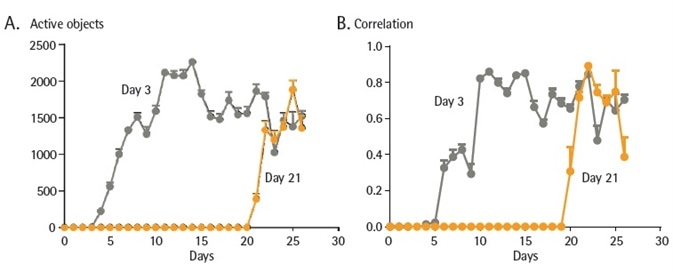
Figure 4. Long term expression of NeuroBurst Orange GECI does not alter neuronal activity. iCell GlutaNeurons were seeded at 30K cells/well with a co-culture of primary rat astrocytes seeded at 15K cells/well on 96- well culture plates. Neurons were infected with NeuroBurst Orange reagent at either day 3 or 21 following plating. Active object number (A) and mean correlation (B) was monitored and analyzed over a period of 27 days. Data points represent Mean ± SEM. Image Credit: Sartorius
Culture conditions impact neuronal activity
Neuronal function can be affected by cell culture conditions. Complete BrainPhys Neuronal Medium is a neurophysiological, serum-free basal medium specifically produced for optimized neuronal function.
Peri.4Ucells were cultured, iPSC-derived peripheral neurons supplied from Ncardia, in either the media provided by the manufacturer or BrainPhys medium (Neuro.4U; Figure 5) to evaluate whether the media could influence the function of iPSC derived neurons.
Qualitative evaluation of cell morphology did not show significant variations in neuronal network structure or cell health. Quantitative measurements of neuronal function show that each of the media types assisted neuronal activity with significantly increased activity noted during the first three days of culture.
The quantity of active objects noted in the Ncardia medium were greater than in complete BrainPhys medium.
Interestingly, while the synchronicity of cells in both culture conditions continued to be low for the duration of the 25 day investigation, higher synchronicity was observed in co-cultures developed in BrainPhys medium in contrast with Ncardia medium.
While variations in environmental factors (supplements and media) do not seem to influence qualitative assessments of network complexity and neuronal morphology, this data shows that there were noticeable changes in neuronal connectivity and function.
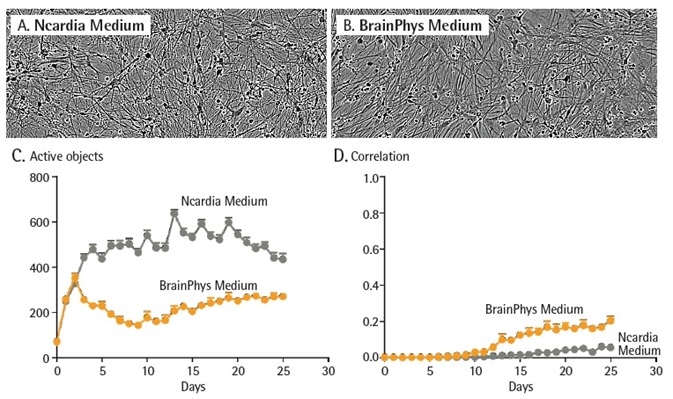
Figure 5. Culture conditions impact neuronal activity. Peri.4U neurons were seeded at 25K cells/wells with a co-culture of primary rat astrocytes seeded at 15K cells/well on 96-well culture plates. Neurons were infected with NeuroBurst Orange reagent at day 2. Cells were then cultured in Complete BrainPhys Medium or Neuro.4U Medium Morphology of the neurons was not affected by media differences (A and B). Active object number (C) and mean correlation (D) were plotted over 25 days in culture. Data points represent Mean ± SEM. Image Credit: Sartorius
Kinetic profile of different iPSC-derived neurons
Utilizing the NeuroBurst Orange Reagent and the Incucyte® S3 for Neuroscience, four different kinds of iPSC-derived neurons were investigated during 30 to 50 days in culture.
These were iCell GlutaNeurons (Figure 6a), iCell GABANeurons (Figure 6b), iCell DopaNeurons (Figure 6c) co-cultured with primary rat astrocytes, along with CNS.4U neurons (Figure 6d).
iCell GlutaNeurons, classified as human glutamatergic-enriched cortical neurons derived from iPSCs, demonstrated a quick induction of calcium burst activity in less than 1,500 cells that became strongly correlated during 10 days of co-culture.
iCell GABANeurons, described as a culture of less than 95% pure population of GABAergic (inhibitory) neurons, additionally showed an efficient increase in the quantity of cells with calcium burst activity during the first week of co-culture.
iCell GABANeurons did not exhibit strong correlation at any tested duration of time, in accordance with their inhibitory phenotype.
A more detailed evaluation of cellular activity at day 14, presented as object traces during the complete 3 minute scan (Figure 6a and b), supports the identification of a large number of active cells in the iCell Gluta- and GABANeurons; the former showing a stronger calcium burst synchronicity and intensity in comparison with the latter.
Interestingly, the kinetics of iCell DopaNeuron activity was very similar to iCell GlutaNeurons, demonstrating a highly efficient induction of strongly correlated, highly active networks during the first 10 days of culture. The CNS.4U cells from Ncardia signify an in vitro co-culture model of hiPSC-derived astrocytes and neurons.
These cells demonstrated a high amount of activity from almost 1,200 cells during the first week of culture and an increase in correlated activity (network connectivity) at around day 34 in culture, attaining a correlation of 0.7 at day 45 when the investigation ended.
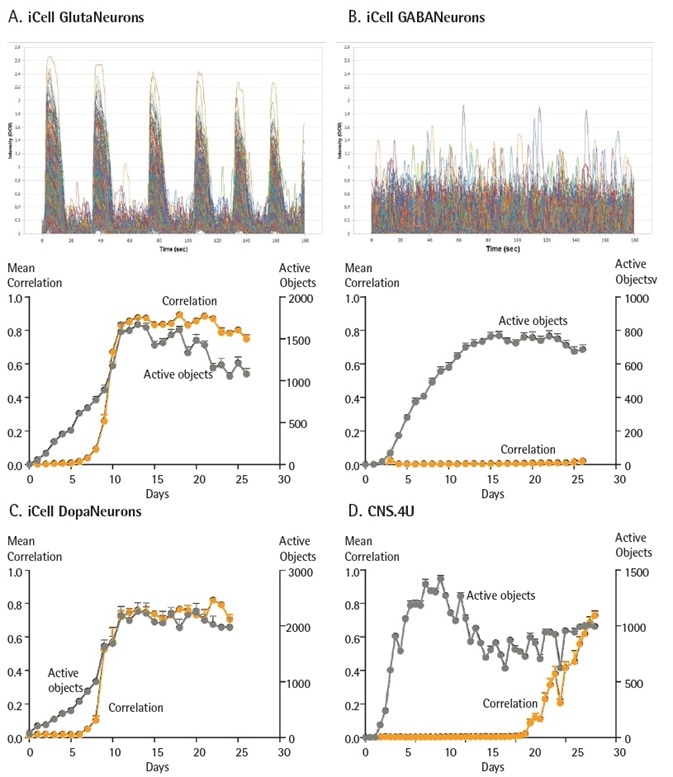
Figure 6. Functional activity of different iPSC-derived neurons. iCell GlutaNeurons, iCell GABANeurons, iCell DopaNeurons (Cellular Dynamics International) and CNS.4U neurons (Ncardia) were all seeded at 20K cells/ well. iCell GlutaNeurons, iCell GABANeurons and iCell DopaNeurons were also plated with a co-culture of rat astrocytes seeded at 15K cells/ well. Neurons were infected with NeuroBurst Orange reagent, and active object number and mean correlation were quantified for up to 45 days. Example calcium oscillation traces and kinetic graphs of activity metrics over time for iCell GlutaNeurons (A) and iCell GABANeurons (B). Mean correlation and active object number were quantified for iCell DopaNeurons (25 days) (C) and CNS.4U neurons (45 days) (D). Data points represent Mean ± SEM. Image Credit: Sartorius
Measurements of neuronal structure vs. function
Peripheral neuropathies are a widespread side effect of chemotherapeutic drugs like paclitaxel (Taxol®) and are related to loss of sensory function and numbness.
To examine the possible neurotoxic effects, primary rat cortical neurons were initially co-cultured with primary rat astrocytes for 11 days, helping the cultures to stabilize and mature.
Baseline measurements of morphology and activity were taken each day utilizing Incucyte® NeuroBurst Orange and Incucyte® Neurolight Orange respectively (Figure 7).
Cultures were treated with various concentrations of Taxol on day 11. Morphology and activity were observed for an additional 11 days in culture. Figure 7 shows that by day 21, at sub-nanomolar (less than 10 to 9 M) concentrations of Taxol, only small variations in neurite length were noted, while a decrease in neuronal activity arose (Figure 7c).
Separate well traces demonstrated both time- and concentration-dependent responses of neuronal activity after Taxol treatment, as presented in Figure 7d.
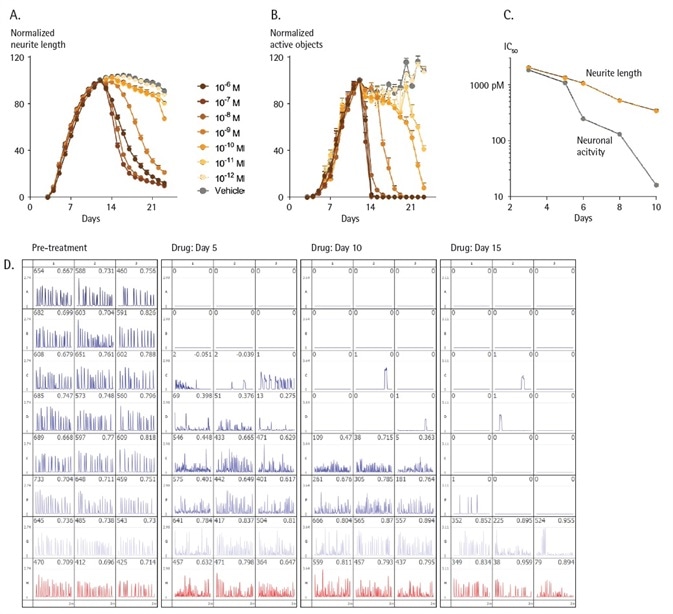
Figure 7. Measurements of neuronal structure vs. function. Rat cortical neurons seeded at 30K cells/well were co-cultured with rat astrocytes seeded at 15K cells/well and transduced with NeuroBurst Orange or NeuroLight Orange at day 3 in culture. Live-cell analysis measurements were made each day using Incucyte® S3 for Neuroscience. After 11 days, neural networks had fully formed and stabilized. Taxol or vehicle control was then added, and cultures were monitored for an additional 11 days. Time-courses of neurite development (A) and neuronal activity (B) prior to, and after the addition of, control or increasing concentrations of Taxol are shown. Potency (IC50 values) plotted against time post-treatment for neuronal activity (grey) and neurite length (orange) (C). Data is expressed as % neurite length or active object count, normalized to the pre-treatment value. Data points represent Mean ± SEM. Neuronal activity summary traces at pre-treatment and at 5, 10- and 15-days post-treatment display decreased activity levels over the course of the experiment (D). Image Credit: Sartorius
Conclusions
In this white paper, data was presented to demonstrate the use of the Incucyte® S3 for Neuroscience to develop and characterize a range of neuronal phenotypes and their maturation to model their function in vitro.
This single live-cell imaging platform enables researchers to evaluate calcium flux kinetics and consistently track the morphology of neuronal populations over the long-term.
This is achieved by utilizing non-invasive reagents, tested protocols that are cell-sparing, and a guided, built-in interface for non-experts offered by the Incucyte® S3 Neuronal Activity Analysis Software Module.
The system can be employed within the incubator of the operator under physiological conditions.
The Incucyte® NeuroBurst Orange reagent was also introduced, which is a genetically-encoded fluorescent calcium sensor that is non-disruptive, robust, and can be utilized with a range of neuronal cell types (for example iPSC-derived models and primary neurons).
This reagent allows scientists to establish when neuronal activity begins and how this activity consistently alters over time, with minimal disturbance and quantitative observation of morphological differences.
Random Ca2+ oscillations can be recorded and captured directly from thousands of neurons during weeks and months. Evaluation is thoroughly assisted with cell-by-cell data via segmentation, and turnkey ‘real time’ visualization of both compressed and raw data.
As outlined above, the reagents and the system can offer beneficial, ‘real world’ kinetic information regarding neuronal network connectivity and activity in neurological models that may be overlooked by conventional end-point analysis.
The Incucyte® S3 for Neuroscience was employed to evaluate the influence of supplements and media on the function and morphology of iPSC-derived neurons in the context of calcium bursting.
As outlined, greater quantities of active cells were detected inside Peri.4U cultures with the use of the Ncardia Medium opposed to the Complete BrainPhys Medium, but there was a higher synchronicity in co-cultures with BrainPhys Medium.
This demonstrates how the quantification of calcium bursting with real-time imaging can identify small functional modifications in response to variations in supplement and media.
Understanding when iPSC-derived neurons are functionally active, how to enhance their activity, and receiving knowledge about the synaptic connectivity of cultured neurons has eluded neuroscience researchers in the past.
Utilizing mainly GABA and Gluta iPSC-derived neuronal models, the Incucyte® S3 for Neuroscience has been shown to offer a way of evaluating a range of cell models utilizing suitable quantitative metrics (such as cellular activity and neurite length.)
The research on CNS.4U neurons, which generate spontaneous activity within days but take less than 30 days to show synaptic connectivity, strongly shows how these models can significantly vary from one another.
Finally, the throughput and robustness offered by the Incucyte® system allows scientists to focus on the isolation of variables in order to enhance the development of iPSC-derived neuronal models.
The Incucyte® S3 for Neuroscience offers a total end-to-end solution for the evaluation of neuronal phenotypes and their maturation. Along with neuronal cell function, it additionally provides crucial data for a broad range of neurological questions that may be overlooked by other techniques.
Resources
- Discover more information on the Neuroscience Literature and Resource page.
- Further information can be found online from www.sartorius.com/incucyte
Related protocols
Incucyte® S3 Neuronal Activity Assay
Reagents
Incucyte® NeuroBurst Orange
Instrumentation
Incucyte® S3 Live-Cell Analysis System for Neuroscience
Information on instruments, reagents, and software
Reagents, Software and Consumables for Neuroscience Research
Neuronal activity reagent ordering information
Table 2. Source: Sartorius
| Product |
Description |
Cat. No. |
| Incucyte® S3 Live-Cell Analysis System for Neuroscience |
Includes image acquisition and analysis system with
• 4x, 10x, and 20x objectives
• Controller with 16.4 TB storage
• HD Dual Color Orange/NIR Optical Module |
4763 |
| Incucyte® S3 Neuronal Activity Analysis Software Module |
Enables microplate analysis of neuronal activity via fluorescent calcium detection and movie mode acquisition. |
9600-0032 |
| Incucyte® NeuroBurst Orange Lentiviral Reagent |
Live-cell neuronal labeling reagent for long-term expression of a fluorescent genetically-encoded calcium indicator. |
4736 |
| Incucyte® NeuroActive Orange Cell Kit |
One kit:
• IncuCyte® NeuroBurst Orange Lentiviral Reagent
• IncuCyte® rAstrocytes
• IncuCyte® rCortical Neurons |
4761 |
Acknowledgments
Produced from materials originally authored by Aaron Overland1, John Rauch1, Libby Oupicka1, Susana Lopez Alcantara2, Nevine Holtz1, Nicholas Dana2, Eric Endsley1, Dave Rock1, Jill Granger1, Del Trezise2, Tim Dale2, and Daniel M. Appledorn1 from:
1. Essen BioScience, Inc., USA
2. Essen BioScience, Ltd., United Kingdom
About Sartorius

Sartorius is a leading international pharmaceutical and laboratory equipment supplier. With our innovative products and services, we are helping our customers across the entire globe to implement their complex and quality-critical biomanufacturing and laboratory processes reliably and economically.
The Group companies are united under the roof of Sartorius AG, which is listed on the Frankfurt Stock Exchange and holds the majority stake in Sartorius Stedim Biotech S.A. Quoted on the Paris Stock Exchange, this subgroup is comprised mainly of the Bioprocess Solutions Division.
Innovative Technologies Enable Medical Progress
A growing number of medications are biopharmaceuticals. These are produced using living cells in complex, lengthy and expensive procedures. The Bioprocess Solutions Division provides the essential products and technologies to accomplish this.
In fact, Sartorius has been pioneering and setting the standards for single-use products that are currently used throughout all biopharmaceutical manufacturing processes.
Making Lab Life Easier
Lab work is complex and demanding: Despite repetitive analytical routines, lab staff must perform each step in a highly concentrated and careful way for accurate results.
The Lab Products and Services Division helps lab personnel excel because its products, such as laboratory balances, pipettes and lab consumables, minimize human error, simplify workflows and reduce physical workloads
Sponsored Content Policy: News-Medical.net publishes articles and related content that may be derived from sources where we have existing commercial relationships, provided such content adds value to the core editorial ethos of News-Medical.Net which is to educate and inform site visitors interested in medical research, science, medical devices and treatments.