The development of the therapeutic antibodies necessitates a complete understanding of the interaction between the antibody and its target.1,4 The binding kinetics between the candidate molecule and its target is a key factor in the screening process.
At present, real-time label-free (RT-LF) biosensors are being employed extensively to evaluate protein-protein interaction.
Surface Plasmon Resonance (SPR) and Bio-Layer Interferometry (BLI) are two general technology platforms that use RT-LF biosensors.2 Both can be used in real-time applications to determine the binding specificity, affinity and kinetics between the tested molecules.
Although SPR is largely considered to be the gold standard in the pharmaceutical industry, BLI has become increasingly popular in recent years as it’s relatively easy to use. Both technologies will offer a fully detailed dataset including binding affinity (KD), binding rate (ka) and dissociation rate (kd) etc. between the molecules.
The type of molecules/compounds deemed compatible can include polypeptides, proteins, oligonucleotides, oligosaccharides, lipoids, phages, viruses and cells, etc. SPR and BLI are similar in basic setup.
First, the protein of interest is immobilized on the surface of the biosensor, which is typically coated with antibodies or compound that can capture the protein selectively. For instance, streptavidin (SA)-coated chips are employed for biotinylated protein, while NTA-coated biosensors are appropriate for his-tagged protein capture.
Following the immobilization stage, the ligand (immobilized protein) will be introduced to a solution containing the analyte.
The binding of the analytes and the immobilized ligands results in a thickness change on the biosensor, generating changes in the index of refraction. Repeated binding and dissociation cycles with analytes of varying concentrations can offer conclusive quantification of binding affinity between the analyte and the ligand.
Sino Biological can provide customized affinity characterization, including both Biacore analysis (Biacore T200) and Octet analysis (Octet RED).
The company utilizes these technologies for a range of applications that include antibody screening, activity testing, consistency evaluation, epitope mapping and quality control testing.
The following section of this article introduces a series of internal case studies.
Antibody-producing cell line screening
Biacore and Octet can be employed for simultaneous evaluation of the expression yield of the tested cell lines and the binding kinetics of the antibodies generated from the same cell line.
The two experiments shown below are an example of employing SPR and BLI to distinguish the candidate antibodies with the preferred binding affinity and high expression yield.
The following Biacore experiments screened 3 cell supernatants against the target 2019-nCoV Spike RBD, with the primary objective of obtaining a cell line with high expression and high-affinity antibodies to the target.
From the subsequent screening data, cell line 127 satisfies the requirements.
In the next Octet experiment, 8 cell supernatants were screened against the target NP-2019-nCoV. The goal is to acquire a cell line that can convey high-affinity antibodies to the target. Taken from the ensuing screening data, 14G9 and the reference 40143-MM08 cell line satisfy the requirements.

| Ligand |
Ligand
Level (RU) |
Sample |
ka
(1/Ms) |
kd
(1/s) |
KD
(M) |
Rmax
(RU) |
Chi²
(RU²) |
Affinity
rank |
| 127 |
334.2 |
RBD |
1.23E+06 |
1.98E-07 |
1.61E-13 |
155.5 |
1.01 |
1 |
| 131 |
152.5 |
RBD |
2.48E+06 |
1.23E-03 |
4.97E-10 |
55.7 |
0.645 |
3 |
| 141 |
144 |
RBD |
5.04E+06 |
1.45E-03 |
2.87E-10 |
46 |
0.779 |
2 |
Figure 1. Screening of cell supernatant against target protein RBD (Biacore data). Image Credit: Sino Biological Inc.
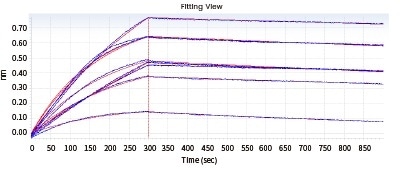
| Loading Sample ID |
Sample ID |
KD (M) |
kon (1/Ms) |
kdis (1/s) |
Full R2 |
| 5.00E+04 |
NP-2019-nCoV |
5.06E-09 |
4.73E+04 |
2.40E-04 |
0.996 |
| 6G3 |
5.01E-09 |
5.53E+04 |
2.77E-04 |
0.994 |
| 12D1 |
1.92E-08 |
5.43E+04 |
1.04E-03 |
0.969 |
| 14A2 |
3.72E-09 |
2.66E+04 |
9.88E-05 |
0.999 |
| 14H10 |
1.13E-08 |
1.33E+04 |
1.50E-04 |
0.999 |
| 14G9 |
2.58E-09 |
6.88E+04 |
1.77E-04 |
0.992 |
| 22B6 |
4.44E-08 |
5.30E+03 |
2.35E-04 |
0.997 |
| 40143-MM08 |
2.67E-09 |
6.26E+04 |
1.67E-04 |
0.997 |
Figure 2. Screening of cell supernatant against target protein NP (Octet data). Image Credit: Sino Biological Inc.
Kinetic screening of candidate antibodies
A kinetic test was conducted to assess a pool of antibody drug candidates as displayed below:
The subsequent Biacore experiment screened eight cell supernatants against the target P protein for the purpose of obtaining antibody cell lines that have high affinity with the target and are hard to dissociate. From the ensuing screening data, cell line No. 2 satisfies the requirements.
In the subsequent Octet experiment, six cell supernatants against the target G protein were screened for the purpose of obtaining cell lines that have high affinity with the target and can be dissociated easier. From the ensuing screening data, the No. 4 cell line satisfies the requirements.
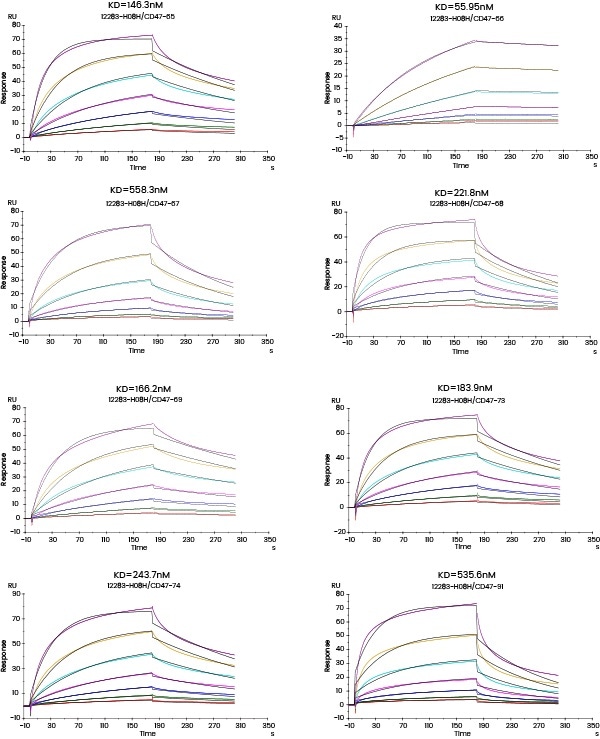
Figure 3. Kinetic screening of candidate molecules against the targets (Biacore data). Image Credit: Sino Biological Inc.
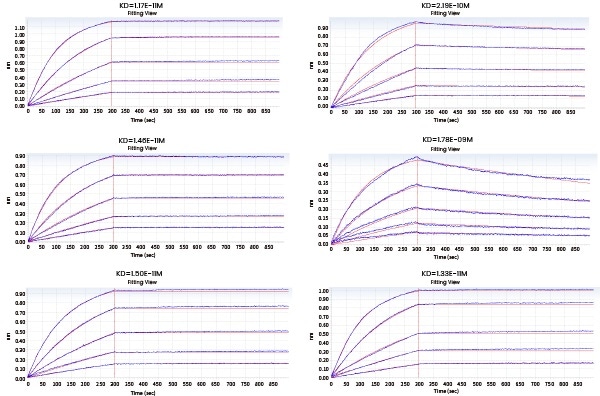
Figure 4. Kinetic screening of candidate molecules against the targets (Octet data). Image Credit: Sino Biological Inc.
Epitope analysis
The antibody epitope mapping can be performed with Biacore and Octet, as demonstrated below.
| First antibody/Second antibody |
mAb1 |
mAb2 |
mAb3 |
mAb4 |
mAb5 |
mAb6 |
| mAb1 |
- |
87% |
-3% |
83% |
77% |
60% |
| mAb2 |
82% |
- |
69% |
1% |
4% |
69% |
| mAb3 |
16% |
97% |
- |
90% |
88% |
78% |
| mAb4 |
94% |
1% |
87% |
- |
3% |
77% |
| mAb5 |
85% |
5% |
66% |
4% |
- |
71% |
| mAb6 |
76% |
84% |
75% |
84% |
82% |
- |
Results of epitope analysis
| Epitope Groups |
Antibody No. |
| Epitope I (possibly same/adjacent) |
114/182 |
| Epitope II (possibly same/adjacent) |
141/206/623 |
| Epitope III (possibly same/adjacent) |
40150-D002 |
Figure 5. Epitope analysis data (Biacore data). Image Credit: Sino Biological Inc.

| First antibody/Second antibody |
mAb1 |
mAb2 |
mAb3 |
mAb4 |
mAb5 |
mAb6 |
| mAb1 |
- |
5.11% |
21.66% |
7.89% |
78.95% |
11.36% |
| mAb2 |
9.23% |
- |
33.69% |
6.24% |
87.62% |
24.55% |
| mAb3 |
33.56% |
23.21% |
- |
21.02% |
83.99% |
12.65% |
| mAb4 |
3.58% |
5.66% |
29.26% |
- |
86.35% |
7.68% |
| mAb5 |
51.22% |
70.65% |
95.43% |
68.09% |
- |
75.07% |
| mAb6 |
32.12% |
2.11% |
5.65% |
7.98% |
73.12% |
- |
Results of epitope analysis
| Epitope Groups |
Antibody No. |
| Epitope I (possibly same/adjacent) |
mAb5 |
| Epitope II (possibly same/adjacent) |
mAb1/2/3/4/6 |
Figure 6. Epitope analysis data (Octet data). Image Credit: Sino Biological Inc.
Comprehensive characterization of drug binding activity
The affinity between the target and its antibody and that between the antibody and the corresponding Fc receptors can be distinguished utilizing Biacore and/or Octet.

| Fc receptor protein |
Analyte |
ka (1/Ms) |
kd (1/s) |
KD (M) |
Rmax (RU) |
Chi² (RU²) |
U-value |
CD16a (V176)
Cat: 10389-H27H1 |
Ab1 |
7.35E+04 |
1.16E-02 |
1.58E-07 |
36.03 |
0.535 |
1 |
CD64
Cat: 10256-H08H |
Ab1 |
6.05E+04 |
5.16E-03 |
8.53E-08 |
54.13 |
1.65 |
2 |
FcRn
Cat: CT009-H08H |
Ab1 |
3.21E+05 |
5.54E-02 |
1.73E-07 |
33.94 |
1.27 |
4 |
Figure 7. Affinity detection of target antibody drugs against Fc receptors (Biacore data). Image Credit: Sino Biological Inc.
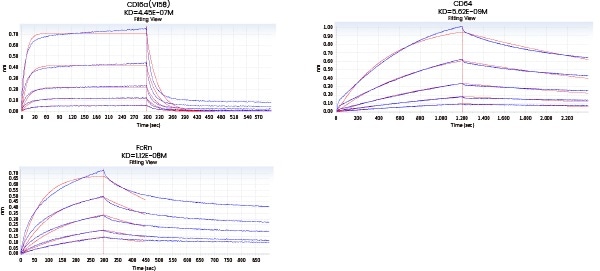
| Loading Sample ID |
Sample ID |
KD (M) |
kon (1/Ms) |
kdis (1/s) |
Full R2 |
CD16a(V176)
Cat: 10389-H27H1 |
Antibody |
4.45E-07 |
8.69E+04 |
3.87E-02 |
0.977 |
CD64
Cat: 10256-H08H |
Antibody |
5.62E-09 |
6.28E+04 |
3.53E-04 |
0.996 |
FcRn
Cat: CT009-H08H |
Antibody |
1.12E-08 |
2.18E+05 |
2.44E-03 |
0.992 |
Figure 8. Affinity detection of target antibody drugs against Fc receptors (Octet data). Image Credit: Sino Biological Inc.
Consistency evaluation
Sensor map details can be contrasted, and similarity scores can be offered directly utilizing Biacore's original fingerprint map comparison functions, eradicating errors typically caused by functions such as model fit selection.
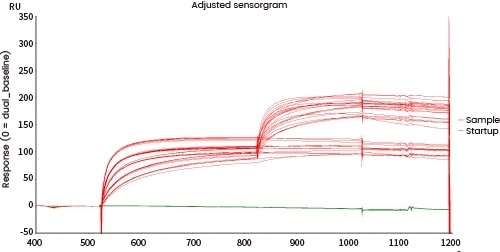
The following case demonstrates the evaluation of the fingerprints of the generic drug Biosimilar and the original drug (Drug D) by utilizing Biacore's consistency analysis software; the results then demonstrated an 81.86% consistency.
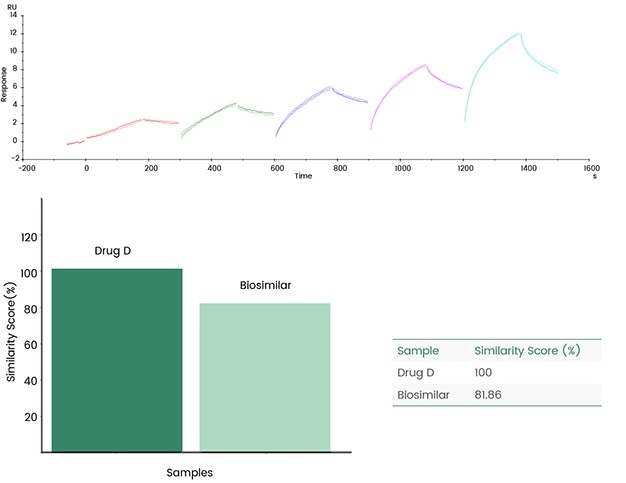
Figure 9. Biacore fingerprint comparison. Image Credit: Sino Biological Inc.
Biological activity quality control
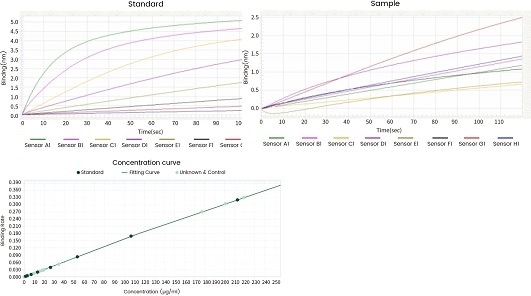
Both SPR and BLI can be employed for the batch release of final biotherapeutic products. The binding kinetics is a signaling factor of batch-to-batch consistency. It can also be utilized for determining the effective activity concentration of target proteins in the products.
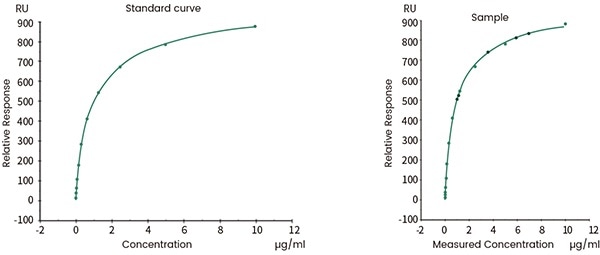
Figure 10. Concentration analysis (Biacore data). Image Credit: Sino Biological Inc.
| Standard |
Known Conc. (µg/ml) |
Sample ID |
Well Conc. (µg/ml) |
| IgG |
212.8 |
1 |
9.2 |
| IgG |
106.4 |
2 |
17.9 |
| IgG |
53.2 |
3 |
217.56 |
| IgG |
26.6 |
4 |
108.54 |
| IgG |
13.3 |
5 |
83.96 |
| IgG |
6.65 |
6 |
28.9 |
| IgG |
3.33 |
7 |
7.38 |
| IgG |
1.66 |
8 |
11.4 |
Figure 11. Concentration analysis (Octet data). Image Credit: Sino Biological Inc.
Summary
SPR and BLI can provide a wide range of benefits over the conventional plate-based ELISA binding assays. Each technique also comes with its own advantages and disadvantages. The user needs to determine which method is better suited for their particular experiment.
Sino Biological can provide affinity testing across both platforms. The company also offers accompanying products and services, such as HTP antibody expression and target protein expression.
Comparison of BLI and SPR technologies
Source: Sino Biological Inc.
| |
BLI |
SPR |
| Advantages |
Higher information for sample; |
Higher throughput; |
| More flexible operations; |
Lower biosensors cost; |
| Higher sensitivity |
Lower sample buffer estrictions |
| Disadvantages |
Higher biosensors cost; |
No thermodynamic parameters |
Reference
- Doi:10.3791/55659
- Doi:10.1016/j.ab.2017.08.002
- Doi:10.3791/59687
- Doi:10.3390/v12060684
About Sino Biological Inc.

Sino Biological is an international reagent supplier and service provider. The company specializes in recombinant protein production and antibody development. All of Sino Biological's products are independently developed and produced, including recombinant proteins, antibodies and cDNA clones. Sino Biological is the researchers' one-stop technical services shop for the advanced technology platforms they need to make advancements. In addition, Sino Biological offers pharmaceutical companies and biotechnology firms pre-clinical production technology services for hundreds of monoclonal antibody drug candidates.
Sino Biological's core business
Sino Biological is committed to providing high-quality recombinant protein and antibody reagents and to being a one-stop technical services shop for life science researchers around the world. All of our products are independently developed and produced. In addition, we offer pharmaceutical companies and biotechnology firms pre-clinical production technology services for hundreds of monoclonal antibody drug candidates. Our product quality control indicators meet rigorous requirements for clinical use samples. It takes only a few weeks for us to produce 1 to 30 grams of purified monoclonal antibody from gene sequencing.
Sponsored Content Policy: News-Medical.net publishes articles and related content that may be derived from sources where we have existing commercial relationships, provided such content adds value to the core editorial ethos of News-Medical.Net which is to educate and inform site visitors interested in medical research, science, medical devices and treatments.