In the manufacture of solid dosage forms, the rate at which the active pharmaceutical ingredient (API) is dissolved into solvents simulating the digestive tract fluids is determined with dissolution testing. The US Pharmacopoeia has descriptions about a number of dissolution testing instruments. However, a typical design involves six to nine temperature-controlled 900mL vessels containing the buffered solvent and a stirring apparatus. After dropping the tablet in the dissolution medium at time zero, a suitable analytical method such as UV spectrophotometry is used to monitor the API concentration in the medium periodically.
The percentage of drug release is plotted against time to obtain the dissolution profile. The duration of the dissolution testing for solid dosage forms with sustained release must to be equal to their designated release time. Sustained release tablets capable of releasing APIs over a period of 24 hours are therapeutically advantageous in many ways. This means that the dissolution testing has to be carried out for a period of 24 hours to evaluate these tablets, and therefore, both the laboratory personnel and equipment are also engaged for the same period. In addition, the dissolution testing can use only very small sampling of the batch.
Near-Infrared Spectroscopy (NIRS)
NIRS measures absorption in the NIR region, which is between the mid-infrared and visible regions of the electromagnetic spectrum. The functional groups’ fundamental absorption bands are very strong and appear in the mid-infrared. The absorbances can be brought within the mid-IR detector’s linear range with KBr pellets, dilutions, or mulls. However, these fundamental bands have overtone absorptions in the NIR spectral region, thus allowing direct measurement with no sample preparation because the absorption is relatively weak. In the NIR region, the SH, NH, CH, and OH bonds exhibit the strongest overtone absorbances. Several researchers have evaluated NIR for determining dissolution profiles as part of QbD and PAT “to corroborate the quality of the product so that it can be readily available for subsequent processes”.
Experimental Procedure
This study involved the addition of ethylcellulose to the formulation of propranolol tablets as the sustained release polymer. Acetyltributyl citrate (ATBC) was added as plasticizer to the tablets in varying concentrations: 0%, 6%, 8%, and 10%. The next step was formulating and compressing the resulting tablets on an Elizabeth-Hata tablet press. For each formulation, dissolution testing was carried out and plotting of the average dissolution profile was done (Figure 1). There were seven batches of tablets formulated with 20% propranolol and different concentrations of ATBC.
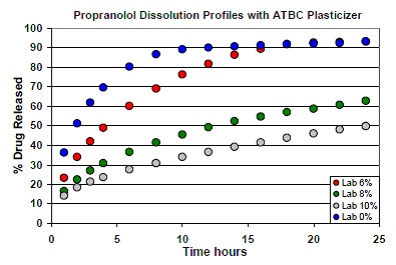
Figure 1. Dissolution profiles of tablets formulated with varying concentrations of ATBC.
The NIRS XDS MasterLab was used in this study. Multiple tablets can be automatically measured following their placement in a special tray (Figure 2), which is to the left in the inset. The NIST traceable standards tray was also present in the right side for photometric and wavelength accuracy and precision. The special tray consisted of 31 pockets measured to the diameter of tablets of interest, allowing the scanning of 31 tablets within 10 minutes by capturing a reference spectrum prior to scanning each 10-tablet set. The transmission mode was used to collect the spectra between 800 and 1650nm at data intervals of 0.5nm, followed by generating a single spectrum through co-addition of 32 scans.
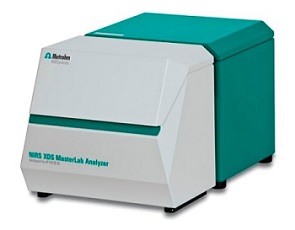
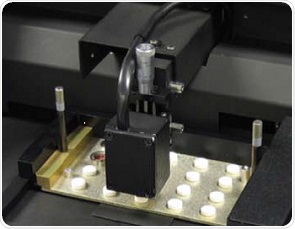
Figure 2. Tablets in the NIRS MasterLab in transmission mode.
Results and Discussion
The second derivative of the calibration set spectra is illustrated in Figure 3. The “fanning out” of the absorbance bands occurred by normalizing the baseline and improving the spectral features. The derivative was then smoothed with a gap of 0 and segment of 10. Scattering was further reduced by applying standard normal variate pre-treatment and the prediction models were developed using partial least squares (PLS) regression. The dissolution profiles were predicted by developing 14 PLS1 models the ATBC plasticizer for a period of 1, 2, 3, 4, 6, 8, 10, 12, 14, 16, 18, 20, 22, and 24 hours.
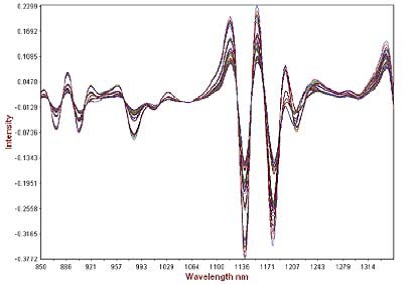
Figure 3. Second derivative math pre-treatment of calibration spectra showing analytical range.
The principal component analysis is used by PLS, which is a deviation of principle component regression (PCR). The Vision® software integrated into the instrument determined the optimum number of principal components or factors by identifying the minimum value point of the predicted residual error sum of squares (PRESS). Only seven of these factors were used by the selected model, and as a result, decreased error is traded off for robustness.
The R2 and the standard error of calibration (SEC) values for the resulting model for 1 hour were 0.9972 and 0.3165, respectively. The standard error of prediction (SEP) for the selected samples was found to be 0.416, with 0.4221 as standard error of cross validation (SECV), good predictability was demonstrated by the one-left-out cross validation. The plot of the NIR predicted percent drug (propranolol) released against the actual drug dissolution results for the hour 1.0 calibration set is depicted in the left hand plot of Figure 4.
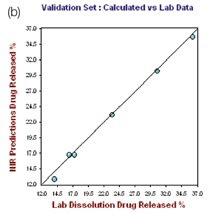
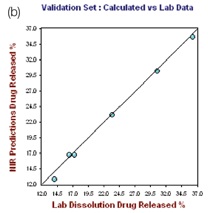
Figure 4. Hour 1, no. of Factor = 7, R2 = 0.9972, SECV = 0.4221
The right hand plot in Figure 4 shows the prediction model validation for which one tablet was not taken for the calibration set at each level. The plots of the NIR predictions of the calibration set and validation set against the lab results for 12 hours and 24 hours are depicted in Figures 5 and 6, respectively.
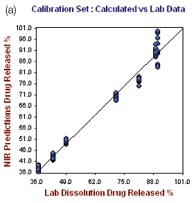
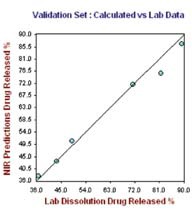
Figure 5. Hour 12, No. of Factor = 7, R2 = 0.9787, CrossVal= 3.4791
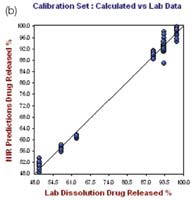
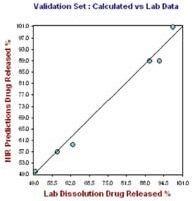
Figure 6. Hour 24, no. of Factor = 7, R2= 0.9919, SECV = 2.1249
The propranolol release from tablets formulated with different levels of ATBC as plasticizer and superimposed NIR predictions are shown in Figure 7. Metrohm’s Vision software has a straightforward routine analysis technique, which allows automated dissolution calculation and generates a report in compliance with 21 CFR part 11.
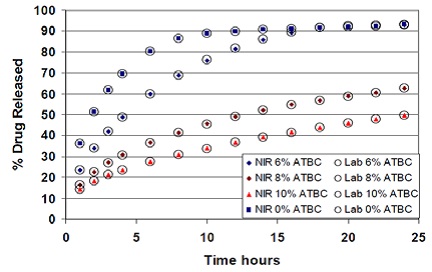
Figure 7. Propranolol release from tablets compressed with varying concentrations of ATBC as plasticizer and superimposed NIR predictions
Conclusion
The results have demonstrated that the assessment of tablets in a rapid, accurate, and non-destructive manner can be achieved in line with the FDA process analytical technology (PAT) initiatives, using the NIR prediction of dissolution profiles of intact tablets. The encouraging results obtained from this method could help minimize the lab workload associated with dissolution testing. The NIRS method was able to analyze 31 tablets within 10 minutes, and predict the tablets’ dissolution profiles for varying concentrations of ATBC closely reproducing the error associated with the lab method.
References
- M. Blanco, et al., Non-destructive dissolution testing by NIR spectroscopy, Sept 2007, Vol. 18, No.6.
- R. Fahmy, Quality by Design: Application of NIR Spectroscopy for Formulation Development of Sustained Release Dosage Forms, Presentation, FDA Center of Veterinary Medicine/University of
- Maryland.
- R. A. Mattes, et al., Near-Infrared Assay and Content Uniformity of Tablets, Pharmaceutical Technology, 4, 2007.
- R. Kramer, Chemometric Techniques for Quantitative Analysis, Marcel Dekker, 1998
About Metrohm
At Metrohm is one of the world’s most trusted manufacturers of high-precision instruments for chemical analysis. Metrohm was founded in 1943 by engineer Bertold Suhner in Herisau, Switzerland. Today, Metrohm is represented in 120 countries by subsidiaries and exclusive distributors. The global Metrohm Group also includes the Dutch companies Metrohm Applikon and Metrohm Autolab, manufacturers of online analyzers and instruments for electrochemical research, respectively. Recently, the Metrohm Group was joined by Metrohm Raman, a leading manufacturer of handheld Raman spectrometers.
Metrohm is the global market leader in analytical instruments for titration. Instruments for ion chromatography, voltammetry, conductivity, and stability measurement make the Metrohm portfolio for ion analysis complete. Instruments for Near-infrared and Raman spectroscopy are another, strongly growing segment of the Metrohm portfolio.
Metrohm is a problem solver, both in the laboratory and within the industrial process. To this end, the company offers their customers complete solutions, including dedicated analytical instrumentation as well as comprehensive application know-how. More than 30% of the company’s employees at the Metrohm international headquarters in Herisau work in R&D.
Metrohm has been owned 100% by the non-profit Metrohm Foundation since 1982. The Metrohm Foundation, which does not exert any influence on the company’s business operations, sponsors gifted students in the natural sciences, supports charitable and philanthropic purposes and, above all, ensures the independence of the company.
Sponsored Content Policy: News-Medical.net publishes articles and related content that may be derived from sources where we have existing commercial relationships, provided such content adds value to the core editorial ethos of News-Medical.Net which is to educate and inform site visitors interested in medical research, science, medical devices and treatments.