Soft contact lenses are known to be extremely delicate. Therefore, they need to be analyzed by a minimum-contact method like NIR spectrometry (NIRS) that provides rapid analysis without causing any damage to them.
This article describes the NIRS analysis of four batches of soft contact lenses, with different, but known moisture levels. Based on the analysis results, a quantitative model was created. The testing process was closely observed so that any issues due to loss of moisture through evaporation could be averted.
The developed model was used to determine the embedded moisture levels of water (H2O) contained in soft contact lenses with nearly 1% standard error of prediction.
Experimental
Each batch comprised three samples. The customer provided lab values for calibration (Table 1).
Table 1. Samples and provided reference values
|
Product (% H2O)
|
Number of lenses per product
|
Spectra per Product
|
|
24 %
|
3
|
5
|
|
38 %
|
3
|
5
|
|
48 %
|
3
|
5
|
|
58 %
|
3
|
5
|
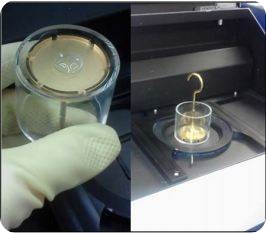
The first step was patting the lens dry by using two dry wipes to carefully press it for four times. The next step was centering the dried lens immediately on a diffuse gold reflector and positioning it in a transflection vessel (Figure 1).

Figure 1. The lens is centered on a diffuse gold reflector in a transflection vessel.
An iris adapter was used to centrally position the transflection vessel on the sample window of the NIRS XDS RapidContent Analyzer (Table 2). The acquisition of the NIR spectrum was carried out by transflection through the vessel bottom. The acquisition time for the collection of the NIRS spectrum for each sample was 16 seconds, and the collective time for pat drying, positioning, and scanning the sample was 1 minutes ± 10 seconds.
Table 2. Used equipment for data acquisition
|
NIRS XDS RapidContent Analyzer
|
2.9211.110
|
|
Iris Adapter
|
6.7425.000
|
|
Liquid Sample Kit for RCA
|
6.7400.010
|
Method Development
The Vision software was used to create a quantitative model based on the 12 spectra obtained from 3 samples of each product. The profile of the spectra was then correlated with the percentage of embedded moisture by developing a partial least squares (PLS) regression. Table 3 lists the method development parameters.
Table 3. Parameter for the PLS Regression Method
|
Method
|
Partial Least Squares
|
|
Regions
|
1372 - 1648nm
|
|
Factors
|
3
|
|
Math Pretreatments
|
Standard Normal Variate (SNV, 1120 - 2500nm)
|
|
Std. Error of Calibration
|
1.69%
|
|
Std. Error of Prediction
|
1.36%
|
|
R2
|
0.9879
|
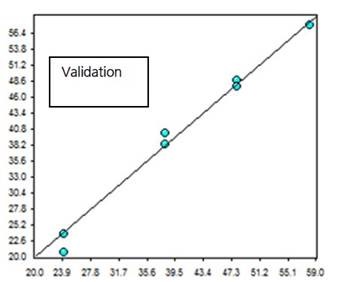
Since the number of samples was less, it was not possible to do external validation. However, the spectra obtained by measuring two samples per product two times were utilized as a self-validation. The relation between the predicted value and air-drying time was examined by performing another experiment. The exposure time of lens to air after patting it dry but before acquiring the data is termed as air-drying time.
Results
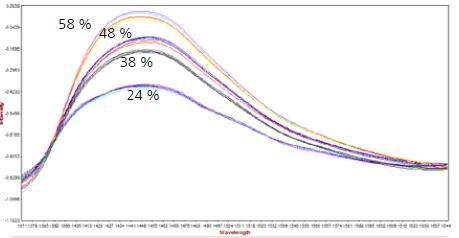
The NIR absorption spectra of various contact lenses depicted in Figure 2 show their water absorption region. Different concentrations exhibited distinct trends, as seen in the figure. The effects of path length variations and scattering are mitigated by applying the standard normal variate (SNV) mathematical treatment.

Figure 2. NIR spectra (with SNV) of the water absorption in soft contact lenses with 24%, 38%, 48%, and 58% embedded water.
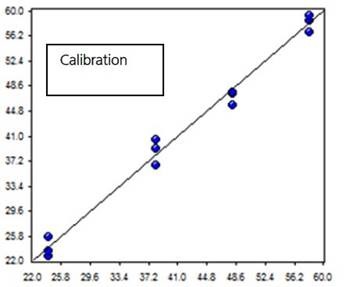
A quantitative model was developed based on PLS calibration. The value of standard error of calibration (SEC) and R2 based on three factors was found to be 1.69% and 0.9879, respectively. The standard error of prediction (SEP) in case of self-validation was 1.36%. Figures 3 and 4 represent the scatter plots obtained by plotting calculated values against lab-reported values for calibration and validation, respectively. These two plots show excellent agreement between the calculated and lab-reported values.

Figure 3. Values calculated from NIRS data using a PLS model vs. lab values for the percentage of embedded water measurement in soft contact lenses.

Figure 4. Values calculated from the validation NIR spectra vs. lab values for the percentage of embedded water measurement in soft contact lenses
The measurement accuracy is affected by air drying, as shown in Table 4. The exposure time of the lens to additional air drying is listed by the sample column. The corresponding NIR prediction is tabulated in the second column.
The results showed the underestimation of the moisture level by the NIR prediction with increasing exposure time. Therefore, it is important to maintain the same data collection time after pat drying each sample for all the measurements. Any variation from the standard procedures may generate erroneous results.
Table 4. Effect of air drying on the accuracy of the measurement
|
Sample
|
NIR Prediction
|
Units
|
|
48%, 1 minutes
|
48
|
%
|
|
48%, 3 minutes
|
47
|
%
|
|
48%, 5 minutes
|
46
|
%
|
|
48%, 7 minutes
|
44
|
%
|
|
48%, 9 minutes
|
43
|
%
|
|
48%, 11 minutes
|
41
|
%
|
Conclusion
The efficacy of using NIR for monitoring the embedded water percentage in soft contact lenses is evident from the experimental results. NIRS is an appropriate method for analyzing water content due to its ability to acquire the spectra easily and rapidly. When compared with conventional methods, NIR analysis is far more advantageous:
- It does not involve any sample preparation.
- Quick analysis times.
- The sample can be recovered without any damage.
- Non-destructive analysis method does not use any solvent and therefore, there’s no waste.
However, errors may occur while recording the spectra when the lens folds over on itself. A reflector having a longer gap length of roughly 1mm prevents folding of the lens, and therefore, avoids the occurrence of erroneous results.
Acknowledgements
Produced from materials originally authored by Ahmed Shawky1,4, Eman S. Elzanfaly2, Maissa Y. Salem2, Ahmed E. El Gindy1, Keith Freel3, Stephen W. Hoag4 and Ahmen Ibrahim1,4.
1Misr International University, Cairo, Egypt
2Cairo University, Cairo, Egypt
3Metrohm USA, Baltimore, MD 21201
4University of Maryland, Baltimore, MD
About Metrohm
At Metrohm is one of the world’s most trusted manufacturers of high-precision instruments for chemical analysis. Metrohm was founded in 1943 by engineer Bertold Suhner in Herisau, Switzerland. Today, Metrohm is represented in 120 countries by subsidiaries and exclusive distributors. The global Metrohm Group also includes the Dutch companies Metrohm Applikon and Metrohm Autolab, manufacturers of online analyzers and instruments for electrochemical research, respectively. Recently, the Metrohm Group was joined by Metrohm Raman, a leading manufacturer of handheld Raman spectrometers.
Metrohm is the global market leader in analytical instruments for titration. Instruments for ion chromatography, voltammetry, conductivity, and stability measurement make the Metrohm portfolio for ion analysis complete. Instruments for Near-infrared and Raman spectroscopy are another, strongly growing segment of the Metrohm portfolio.
Metrohm is a problem solver, both in the laboratory and within the industrial process. To this end, the company offers their customers complete solutions, including dedicated analytical instrumentation as well as comprehensive application know-how. More than 30% of the company’s employees at the Metrohm international headquarters in Herisau work in R&D.
Metrohm has been owned 100% by the non-profit Metrohm Foundation since 1982. The Metrohm Foundation, which does not exert any influence on the company’s business operations, sponsors gifted students in the natural sciences, supports charitable and philanthropic purposes and, above all, ensures the independence of the company.
Sponsored Content Policy: News-Medical.net publishes articles and related content that may be derived from sources where we have existing commercial relationships, provided such content adds value to the core editorial ethos of News-Medical.Net which is to educate and inform site visitors interested in medical research, science, medical devices and treatments.