The assistance of an analyst is often sought after for determining an analyte in scenarios where the elimination or accurate reproduction of a matrix in a blank sample is not possible. Such scenarios are commonly encountered in chemical and environmental effluents or clinical samples. Techniques like ion-selective electrodes (ISE) and atomic absorption spectroscopy (AAS) have been used by chemists for a long time now for analyzing such samples. However, standard additions method is preferred for most sample analyses. In this method, the unknown is used as constant matrix technique in which the analyte is added in controlled amounts. The calibration curve is produced by taking the entire spectrum into consideration.
The limits for content of drugs supplied over-the-counter and those based on prescriptions have been set by the Food and Drug Administration (FDA) and United States Pharmacopeia (USP). The contents of the individual tablets must be between 90 and 110% of that claimed by the label, during the shelf life mentioned on the bottle. Internal specifications are normally more stringent to permit normal potency loss during shelf life. In case of less stable, volatile or expensive materials, these specifications are as strict as 98 to 102%.
A critical factor that influences the cost is the actual limits of release. Additional formulation and adequate pilot plant time are required for achieving stringent limits. Due to the strict in-process and QC testing of the end product, the overall manufacturing cost of the product increases. The production costs are increased further if rejected batches are higher. Therefore, a reduction in the limiting conditions helps bring down the costs.
The span of the near-infrared (NIR) region in the electromagnetic spectrum is between 700 and 2500nm, which starts at the end of the visible region and ends at the beginning of the traditional infra-red region. The NIR spectrum is characterized by overtones and combination bands that originate in the mid-range IR region. It is possible to make direct diffuse reflectance measurements without diluting the sample first because extinction coefficients are lower in the NIR region.
Experimental Procedure
The Model 6500 NIR spectrophotometer from FOSS NIR Systems that was fitted with a remote reflectance fiber optic probe was used for performing the analysis. Since this instrument does not exist now, it is recommended to use the NIRS XDS Rapid Content Analyzer. The analysis used three sample holders, namely, a single tablet holder, a commercial sample cup or the larger closed cup for holding more weight than a single tablet, and a Teflon mini-cup with 1 x 10mm dimple. The pharmaceutical formulations were bought over-the-counter, out of which generic aspirin and acetaminophen were supermarket store brands. Based on the brand recognition and the easy availability of Tylenol and Bayer products, they were chosen as proprietary products. The analysis also used USP grade pure substances that were validated by a commercial QC department for adherence to USP specifications.
For each dosage formulation, an average weight was determined, followed by weighing 10 tablets with an active content varying from 25% to 200% of the level in the tablets themselves. The next step was finely pulverizing these mixtures and scanning them in the spectrophotometer. It was assumed that the «as is» ground tablets contained 100% of the amount of drug as mentioned in the label, and the mixtures used subsequently were labeled as 125%, 150% and so on. The three sample holders were then used.
The second derivative spectra were used for calculating the multiple linear regression calibration for each experiment because most of the particle size effects and packaging variances are nullified by the second derivative. The percentages in each tablet were then predicted based on these equations.
Results and Discussion
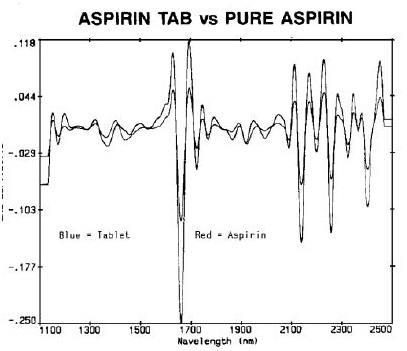
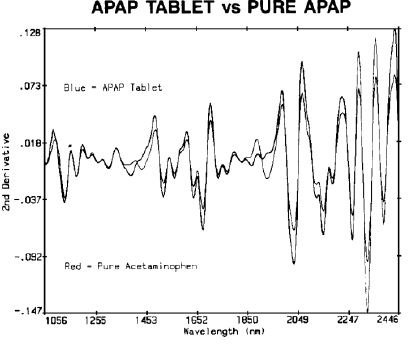
Acetaminophen (N-acetyl-para-aminophenol, APAP) and aspirin (acetylsalicylic acid, ASA) are among the top remedies for pain relief, and therefore, the content uniformity testing was performed by comparing two top brands with generic samples. Comparison of pure aspirin with an ASA tablet is shown in Figure 1, and comparison of APAP and acetaminophen is shown in Figure 2.

Figure 1. Aspirin tab vs. Pure Aspirin

Figure 2. APAP tablet vs pure APAP
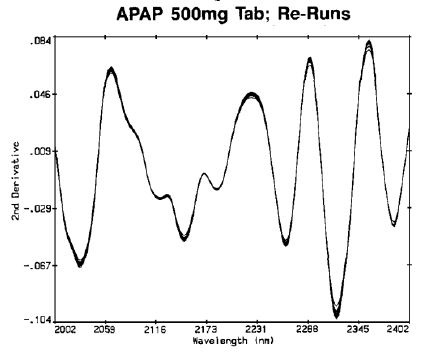
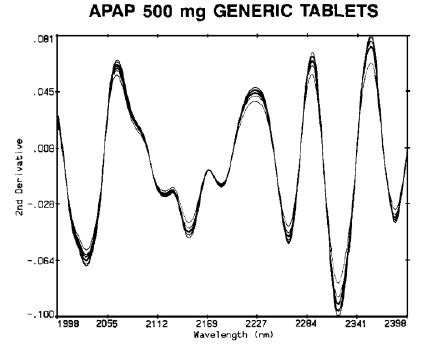
Although positioning of individual tablets needed to be done carefully, it was observed that the differences between repeat scans and positions (Figure 3) were significantly lesser than between different tablets (Figure 4).

Figure 3. APAP 500mg tab re-runs

Figure 4. APAP 500mg generic tablets
The sample area in the closed cup was not filled completely by a single tablet, and therefore, for achieving good results, the single tablet holder was used with bias adjustments as and when required. However, the mini-cup yielded the best results. It is extremely easy to reproduce the surface areas and depths of the standard and single tablets using this approach, which is also compatible to two, three and even four component dosage forms. The results of a 325mg store-bought aspirin tablet are shown in Table 1, while the results of the “name” brands are shown in Table 2.
Table 1. Generic aspirin 325mg, content uniformity
|
Tablet #
|
% Found
|
|
1
|
96.98
|
|
2
|
97.46
|
|
3
|
103.61
|
|
4
|
99.55
|
|
5
|
99.29
|
|
6
|
102.59
|
|
7
|
96.66
|
|
8
|
101.91
|
|
9
|
104.13
|
|
10
|
106.09
|
|
11
|
102.54
|
|
12
|
91.62
|
|
13
|
99.94
|
|
14
|
98.67
|
|
15
|
108.66
|
|
16
|
108.96
|
|
17
|
98.94
|
|
18
|
99.48
|
|
Average = 100.95%
|
Table 2. Bayer 325mg, content uniformity
|
Tablet #
|
% Found
|
|
1
|
98.98
|
|
2
|
99.46
|
|
3
|
101.61
|
|
4
|
99.55
|
|
5
|
99.29
|
|
6
|
101.59
|
|
7
|
99.66
|
|
8
|
101.91
|
|
9
|
99.13
|
|
10
|
99.09
|
|
11
|
98.54
|
|
12
|
101.63
|
|
13
|
100.94
|
|
14
|
100.67
|
|
15
|
101.67
|
|
16
|
99.96
|
|
17
|
99.94
|
|
18
|
100.52
|
|
Average = 100.23%
|
The analysis results of 500mg APAP tablets, generic and “name” brands are shown in Tables 3 and 4, respectively.
Table 3. Generic acetaminophen 500mg tablets, content uniformity
|
Tablet #
|
% Found
|
|
1
|
102.23
|
|
2
|
103.48
|
|
3
|
103.27
|
|
4
|
99.74
|
|
5
|
98.46
|
|
6
|
97.62
|
|
7
|
100.24
|
|
8
|
101.77
|
|
9
|
98.69
|
|
10
|
99.66
|
|
11
|
98.39
|
|
12
|
103.70
|
|
13
|
102.47
|
|
14
|
100.19
|
|
15
|
105.53
|
|
16
|
94.98
|
|
17
|
99.10
|
|
18
|
97.59
|
|
19
|
98.25
|
|
20
|
100.82
|
|
Average = 100.15%
|
Table 4. Tylenol 500mg, content uniformity
|
Table #
|
% Found
|
|
1
|
101.83
|
|
2
|
103.48
|
|
3
|
102.77
|
|
4
|
98.74
|
|
5
|
99.46
|
|
6
|
99.11
|
|
7
|
99.84
|
|
8
|
101.77
|
|
9
|
99.59
|
|
10
|
99.67
|
|
11
|
98.79
|
|
12
|
101.70
|
|
13
|
101.47
|
|
14
|
100.19
|
|
15
|
101.54
|
|
16
|
99.98
|
|
17
|
99.10
|
|
18
|
99.60
|
|
19
|
99.75
|
|
20
|
100.82
|
|
Average = 100.46%
|
Conclusion
The results obtained from the aforementioned procedure show excellent agreement with the HPLC results. The reproducibility limit in case of duplicate injections of an HPLC solution is just 2% in the USP. The aforementioned procedure also demonstrated a comparable precision.
About Metrohm
At Metrohm is one of the world’s most trusted manufacturers of high-precision instruments for chemical analysis. Metrohm was founded in 1943 by engineer Bertold Suhner in Herisau, Switzerland. Today, Metrohm is represented in 120 countries by subsidiaries and exclusive distributors. The global Metrohm Group also includes the Dutch companies Metrohm Applikon and Metrohm Autolab, manufacturers of online analyzers and instruments for electrochemical research, respectively. Recently, the Metrohm Group was joined by Metrohm Raman, a leading manufacturer of handheld Raman spectrometers.
Metrohm is the global market leader in analytical instruments for titration. Instruments for ion chromatography, voltammetry, conductivity, and stability measurement make the Metrohm portfolio for ion analysis complete. Instruments for Near-infrared and Raman spectroscopy are another, strongly growing segment of the Metrohm portfolio.
Metrohm is a problem solver, both in the laboratory and within the industrial process. To this end, the company offers their customers complete solutions, including dedicated analytical instrumentation as well as comprehensive application know-how. More than 30% of the company’s employees at the Metrohm international headquarters in Herisau work in R&D.
Metrohm has been owned 100% by the non-profit Metrohm Foundation since 1982. The Metrohm Foundation, which does not exert any influence on the company’s business operations, sponsors gifted students in the natural sciences, supports charitable and philanthropic purposes and, above all, ensures the independence of the company.
Sponsored Content Policy: News-Medical.net publishes articles and related content that may be derived from sources where we have existing commercial relationships, provided such content adds value to the core editorial ethos of News-Medical.Net which is to educate and inform site visitors interested in medical research, science, medical devices and treatments.