The pharmaceutical industry often uses a process called fluid bed granulation to create solid dosage forms. A number of parameters like the size of particles and moisture content of granules are established with the aid of off-line and in-line near-infrared (NIR) spectroscopy. The resultant data can be leveraged to gain a better insight into the process and thus, enhance the process control significantly.
In order to ensure optimum quality of granules and thus the ensuing final dosage form, the level of moisture during the entire granulation process, i.e., the spraying and drying phases, plays an important role. This parameter is also used to establish the batch quality. Failure to control or monitor the moisture levels would lead to under wetting or over wetting of the powder bed, which would eventually affect the quality of the batch.
A major parameter that impacts the performance of end products is particle size. End product performance includes content stability, evenness, and dissolution. As such, conventional moisture analysis and particle size analysis techniques are off-line and involve significant amount of time.
In addition, these methods are known to have a high cost per analysis, making them unsuitable for control and optimization of processes or for transient measurements for tracking trends. Conversely, a process analytical technology called rapid in-line or off-line NIR spectroscopy can be utilized to determine chemical and physical properties at the same time.
Purpose
The aim of this study is to assess off-line and in-line NIR methodologies to make real-time predictions of particle size and moisture content throughout the entire granulation process: the spraying and drying phases.
Materials and Instrumentation
The granulation formulation taken for the experiment includes 32% w/w of acetaminophen as the active ingredient, 43.5% w/w of lactose monohydrate, Avicel® PH-102, 22% w/w of microcrystalline cellulose, 2% w/w of croscarmellose sodium, 0.5% w/w of magnesium stearate, and PVP (Kollidone® K30) in water.
Next, Magnaflow® fluid bed processor (Model 002) was used to carry out the granulation process. The size of the granules was determined through laser diffraction by means of Malvern’s Mastersizer X/S and at last, the granules’ moisture level was measured by loss on drying (LOD).
Inline NIR
The in-line spectra were acquired with the Metrohm NIRS XDS process analyzer. In each individual spectrum, 16 averaged scans recording data ranging from 800 to 2200nm was included. Metrohm’s purge or scoop probe was integrated into a granulator at an angle of 45° to the central axis (Figure 1).
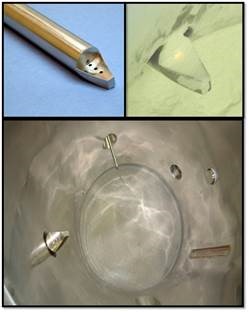
Figure 1. NIR scoop probe installed in fluid bed granulator
This probe was particularly developed for fluid bed analysis. A spoon provided at the end of the probe is used to collect the sample. Once the scan has been obtained, an air purge (80psi) initiated by the Vision software resends the sample to the granulator and enables testing of the subsequent sample.
Offline NIR
Offline NIR reflectance measurements were made using the Metrohm NIRS XDS RapidContent Analyzer (RCA) (Figure 2). After transferring the samples in closed glass vials, the same were scanned in reflectance mode across 400 to 2500nm wavelength, with data being collected every 0.5nm.
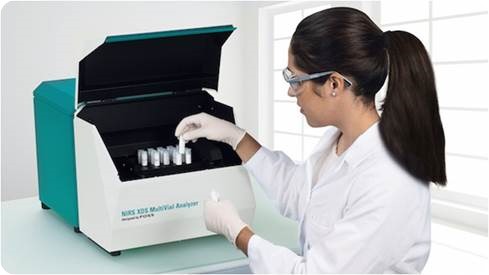
Figure 2. Metrohm NIRS RCA
NIR Method Development
Due to the secondary nature of NIR measurements, NIR techniques based on Karl-Fischer titration, light scattering, and other primary techniques, need to be developed and verified. Subsequently, NIR spectra were used to develop regression models.
These spectra were collected during 15 diverse batches of granulation with matching primary laboratory values of 100 samples obtained across the batches. In order to verify the regression models, NIR predictions were compared against the primary laboratory values for samples collected during more batches of granulation. Table 1 shows the details of the regression techniques.
Table 1. D1: first derivative, MC: mean centering, SNV: standard normal variate. Root mean square error of calibration (RMSEC), cross validation (RMSECV) and prediction (RMSEP)
|
PLS model
|
Moisture Content
(Inline-NIR)
|
Moisture Content
(Offline-NIR)
|
Granule mean diameter
(Inline-NIR)
|
Granule mean diameter
(Offline-NIR)
|
|
Spectral range selected (nm)
|
1870-1970
|
1870-1970
|
800-2200
|
400-2500
|
|
Spectral preprocessing
|
D1+MC
|
SNV+MC
|
Log10+MC
|
Log10+MC
|
|
Number of PLS factors
|
2
|
3
|
3
|
3
|
|
RMSEC
|
3.44
|
2.94
|
26.65
|
20.36
|
|
RMSECV
|
3.60
|
3.07
|
28.06
|
21.83
|
|
RMSEP
|
2.70
|
2.66
|
21.44
|
14.79
|
|
R2 Prediction
|
0.957
|
0.988
|
0.899
|
0.927
|
Results and Discussion
The right side of Table 1 shows NIR spectra that were obtained during the entire granulation process. The occurrence of the absorption bands is attributed to the overtone vibrational modes and integration of components in the blend, which also includes water.
Two major forms of spectral difference were observed. The first spectral difference was a baseline shift that occurred due to changes in the sample’s physical properties. The second was a variation in the absorption intensity near 1950nm, which happens to be a familiar OH stretch area for water.
In order to match the spectral difference to the primary laboratory values, the PLS regressions were formulated. Using the regression results, the NIR predictions (y-axis) are compared with the primary laboratory values (x-axis) to calibrate and validate the particle size and moisture models (Figure 3).
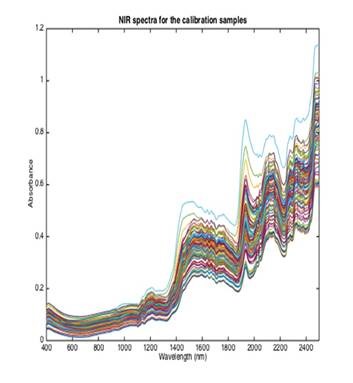
Figure 3. NIR spectra acquired for calibration samples.
With regard to in-line analysis, the level of moisture in the fluid bed granulator was estimated by developing a two factor PLS prediction model. Based on this model, the R2 of prediction and RMSEP values were found to be 0.957 and 2.70, respectively. With regard to off-line analysis, the moisture level in the fluid bed granulator was predicted by developing a three factor PLS prediction model. This model yielded R2 of prediction and RMSEP values of 0.988 and 2.66.
Particle Size (Granule Mean Diameter)
In the case of in-line analysis, the granule mean diameter (D4,3) of the fluid bed granulator was estimated by developing a three factor PLS prediction model. R2 of prediction and RMSEP values obtained based on this model were 0.899 and 21.44, respectively. In the context of off-line analysis, the granule mean diameter (D4,3) of the fluid bed granulator was predicated by developing a three factor PLS prediction model. This model led to R2 of prediction and RMSEP values of 0.927 and 14.79.
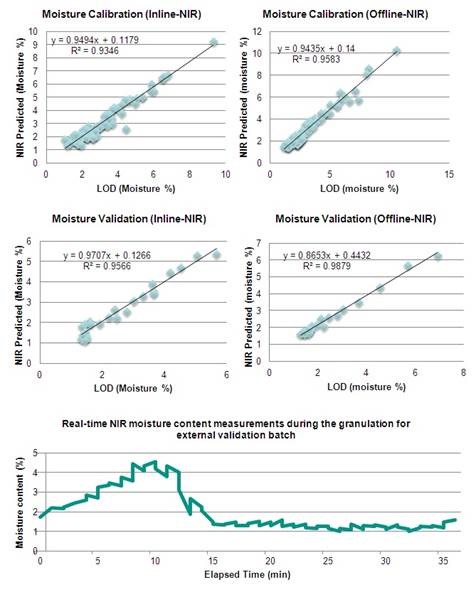
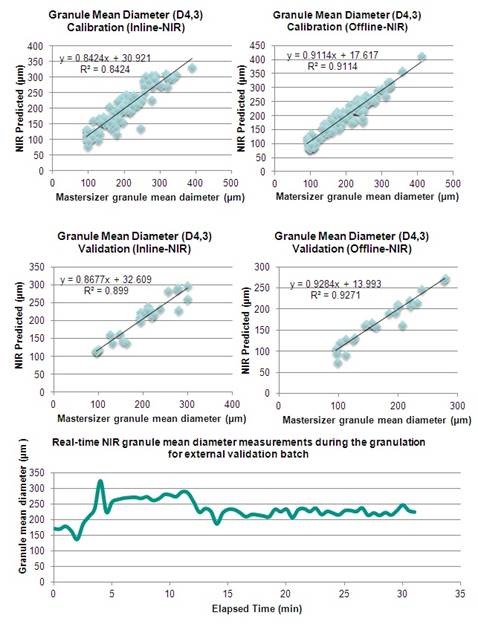
Figure 4. Real-time NIR predictions of moisture content and particle size.
The two images given at the bottom of Figure 4 demonstrate real-time NIR predictions made for the granule mean diameter as well as for moisture content throughout the entire granulation process during one specific validation batch.
Conclusion
The above details demonstrate that real-time predictions of particle size and moisture content of granules can be made using NIRS with PLS regression models. These predictions can be made after employing suitable preprocessing and regression techniques.
The dynamics in-line NIR rendered the composed effect of real factors throughout the entire granulation process on the NIR absorbance, whereas the static off-line NIR offered the individual effects of the particle size and moisture level on the NIR absorbance.
Acknowledgements
Produced from materials originally authored by Ahmed Shawky1,4, Eman S. Elzanfaly2, Maissa Y. Salem2, Ahmed E. El Gindy1, Keith Freel3, Stephen W. Hoag4, Ahmed Ibrahim1,4 from:
1Misr International University, Cairo, Egypt
2Cairo University, Cairo, Egypt
3Metrohm USA, Baltimore, MD 21201, [email protected]
4University of Maryland, Baltimore, MD
About Metrohm
At Metrohm is one of the world’s most trusted manufacturers of high-precision instruments for chemical analysis. Metrohm was founded in 1943 by engineer Bertold Suhner in Herisau, Switzerland. Today, Metrohm is represented in 120 countries by subsidiaries and exclusive distributors. The global Metrohm Group also includes the Dutch companies Metrohm Applikon and Metrohm Autolab, manufacturers of online analyzers and instruments for electrochemical research, respectively. Recently, the Metrohm Group was joined by Metrohm Raman, a leading manufacturer of handheld Raman spectrometers.
Metrohm is the global market leader in analytical instruments for titration. Instruments for ion chromatography, voltammetry, conductivity, and stability measurement make the Metrohm portfolio for ion analysis complete. Instruments for Near-infrared and Raman spectroscopy are another, strongly growing segment of the Metrohm portfolio.
Metrohm is a problem solver, both in the laboratory and within the industrial process. To this end, the company offers their customers complete solutions, including dedicated analytical instrumentation as well as comprehensive application know-how. More than 30% of the company’s employees at the Metrohm international headquarters in Herisau work in R&D.
Metrohm has been owned 100% by the non-profit Metrohm Foundation since 1982. The Metrohm Foundation, which does not exert any influence on the company’s business operations, sponsors gifted students in the natural sciences, supports charitable and philanthropic purposes and, above all, ensures the independence of the company.
Sponsored Content Policy: News-Medical.net publishes articles and related content that may be derived from sources where we have existing commercial relationships, provided such content adds value to the core editorial ethos of News-Medical.Net which is to educate and inform site visitors interested in medical research, science, medical devices and treatments.