Immunoglobulin G (IgG) is the dominant antibody isotype in human serum and appears in four variants: IgG1, IgG2, IgG3 and IgG4. Given their critical role in the immune system, IgGs are a major focus of research, particularly regarding their structure and functional properties.
IgGs are beta-sheet-rich proteins composed of two identical heavy chains and two identical light chains linked by disulfide bonds. The light chains contain the antigen-binding site and exhibit high variability among different antibodies. In contrast, the heavy chains are more conserved and include a fragment crystallizable (Fc) region, which plays a key role in immune function.
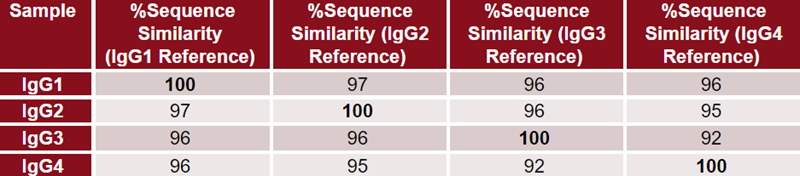
Extensive research has focused on the Fc region, as its engineering can enhance IgG half-life and modulate immune effector functions.1,2 Previous mapping of IgG1–4 Fc region sequences has revealed their relative similarities, with IgG1 and IgG2 being the most alike, while IgG3 and IgG4 show the greatest differences, as summarized in Table 1.
Table 1. Sequence similarity in percentage among the Fc regions of each IgG. Each column uses a different polypeptide as the reference. Data obtained and generated from Protein Data Bank. Source: ACROBiosystems
Beyond the primary sequence, understanding the higher-order structure of the Fc region is crucial for developing therapeutic antibodies, as it provides insights into folding and function.
Crystallized Fc fragments exhibit similar proportions of higher-order structural elements, characterized by high beta-sheet content and low alpha-helix content, as shown in Figure 1. However, minor structural variations do exist.
While crystal structures of Fc fragments are widely available, obtaining structural information in an aqueous environment would be particularly valuable for companies developing drug formulations.
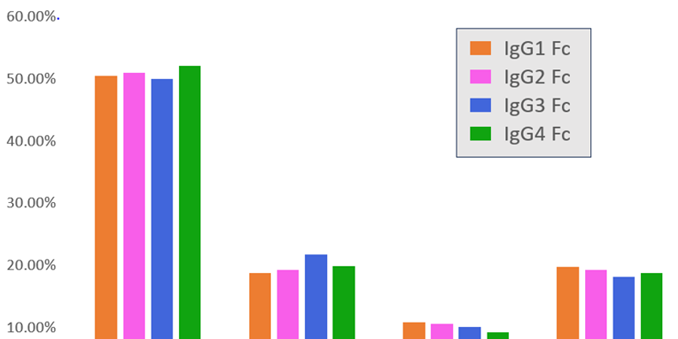
Figure 1. HOS bar chart of the crystallized Fc structures for each IgG generated using Visual Molecular Dynamics.7 Data for the Fc region of each IgG was obtained from Protein Data Bank.3-6 Image Credit: Source: ACROBiosystems
In the work discussed in this article, the structure of Fc fragments of IgG1, IgG2, IgG3 and IgG4 in formulation conditions were analyzed using Microfluidic Modulation Spectroscopy (MMS).
Methods
The IgG variants were provided as lyophilized powders, with IgG1, IgG3, and IgG4 lyophilized from a filtered solution in tris with glycine, arginine, NaCl, and trehalose, and IgG2 from a filtered solution in phosphate-buffered saline (PBS) and trehalose.
Each sample was dialyzed in PBS and concentrated to approximately 2 mg/mL with correct buffer matching.
The samples were analyzed in triplicate on an AQS3pro equipped with sweep scanning capabilities. A flow cell with a 22.3 µm path length was employed. All results were averaged over three replicates.
To determine protein structure, MMS analyzes the amide I band of the IR spectrum, using modulation against the reference buffer for real-time background subtraction in aqueous-based samples.
Thanks to its background subtraction capability, MMS is compatible with a wide range of formulation buffers, avoiding the interference common in other methods. Additionally, MMS systems utilize a high-power Quantum Cascade Laser, which significantly enhances intensity compared to traditional FTIR light sources.
The combination of high light intensity and modulated background subtraction makes MMS five times more sensitive than CD and approximately 30 times more sensitive than FTIR for detecting small structural changes.8
This enhanced background subtraction and sensitivity allows for analysis under formulation conditions, providing the most accurate representation of the biologic drug as it will be administered to patients.
Results
Table 2 shows the structural similarity of IgG samples determined using the area of overlap of MMS results. IgG1 and IgG2 exhibited the highest similarity, while IgG3 and IgG4 exhibited the lowest.
All similarity percentages were below the repeatability (N=3) of their respective samples, showing they have different secondary structures. This is consistent with the fact that each sample came from a distinct polypeptide.
Comparison with the sequence similarities in Table 1 showed that certain similarity trends remained the same, regardless of analysis technique. These included the association of sequence similarity increase with structural similarity increase, and IgG1 and IgG2 exhibiting the highest similarity and IgG3 and IgG4 the lowest.
However, structural and sequence similarity were not the same and no quantifiable relationship between the two was discerned. This demonstrated that sequence similarity is a poor quantitative proxy for structural similarity, emphasizing the importance of tools like MMS in making accurate structural conclusions.
Table 2. Structural similarity and sequence similarity for each IgG. Structural similarity data were obtained and calculated by MMS. Sequence similarity data were generated from Protein Data Bank. Each column uses a different sample as the reference for similarity comparison. Source: ACROBiosystems
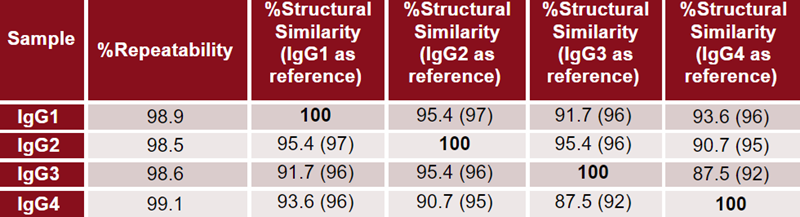
Figure 2 shows the graphical MMS results for all samples, including the absolute spectra (A), second derivative (B), delta plot (C) and HOS fractional composition (D).
Absolute spectra were normalized for concentration and background subtracted. Second derivatives were calculated to enhance regions of small change, and delta plots show the deviation from that of a reference (IgG4).
Finally, the second derivative plot was also inverted, baseline subtracted and fitted with Gaussian curves to determine the HOS fractional composition. Table 3 shows the data of Figure 2(D) and compares the values to those determined from X-ray, as shown in Figure 1.
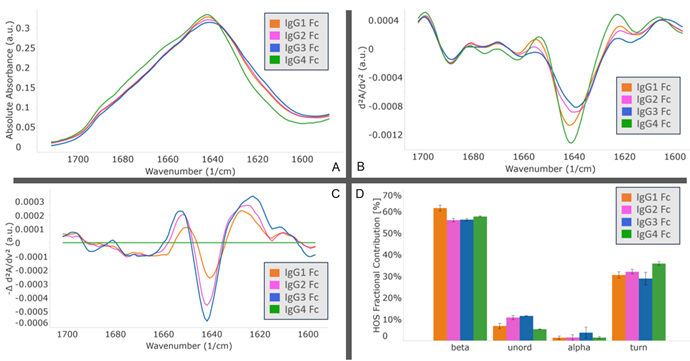
Figure 2. Absolute absorbance (A), second derivative (B), delta of second derivative (C), and HOS bar charts (D) are shown. In the delta plot (C), IgG4 was used as the reference spectrum. Image Credit: Source: ACROBiosystems
Table 3. Comparison of HOS determined by x-ray crystallography and MMS. Values are shown as % fractional contribution of each secondary structural type. Source: ACROBiosystems
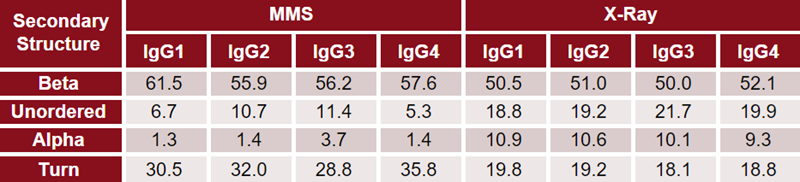
There is strong agreement in HOS composition as determined by X-ray crystallography and MMS. Both methods demonstrated that all IgGs contain over 50 % beta-sheet content, with alpha-helix being one of the least prevalent secondary structural elements.
However, X-ray crystallography identified a greater fraction of alpha-helix and unordered structure in these samples, in contrast with MMS, which identified a higher fraction of beta-sheet and turn structure.
Comparison of IgG subclasses within each method revealed subtle but noticeable differences in all secondary structural types. The structural differences between IgG subclasses were greater when studied with MMS than when X-ray crystallography was studied.
Discrepancies may be the result of structural differences between the protein in aqueous solution and crystalline form. They also suggest that IgG subclasses in solution exhibit more structural varieties than in crystalline form.
A previous study showed that proteins with more hydrophilic amino acids exhibit more structural differences in crystal and solution-based forms than those with more hydrophobic amino acids.9
IgGs usually consist of about 50 % hydrophilic and 50% hydrophobic amino acids. Therefore, they are likely to exhibit moderate levels of structural discrepancy between crystal and solution forms.
This emphasizes the potential of MMS to both perform precise measurements and verify results obtained from other instrumentation.
Conclusions
The work presented in this article studied and compared the secondary structure of IgG1-4 Fc regions using MMS. All samples exhibited similar but distinct structure, characterized by high beta sheet and low alpha helix content, as expected, and relative structural similarities were determined and discussed.
IgG1 and IgG2 exhibited the highest structural similarity (95.4 %), while IgG3 and IgG4 exhibited the lowest (87.5 %). This structural relationship is consistent with the sequence relationship between subclasses. IgG1 and IgG2 showed the greatest sequence similarity (97 %) and IgG3 and IgG4 least (92 %).
Additionally, HOS determination with MMS and X-ray crystallography was consistent, but MMS indicated greater structural variety in IgG subclasses in solution compared with their crystalline form.
This highlights the strengths of MMS in determining the structural identity of a polypeptide. The techniques can provide simple and rapid measurements of similarity and structure, as well as fill the gap of secondary structure characterization of biomolecules in formulation conditions.
References and further reading
- Ko, S., Jo, M. and Jung, S.T. (2021). Recent Achievements and Challenges in Prolonging the Serum Half-Lives of Therapeutic IgG Antibodies Through Fc Engineering. BioDrugs, 35(2), pp.147–157. https://doi.org/10.1007/s40259-021-00471-0.
- Wang, X., Mathieu, M. and Brezski, R.J. (2017). IgG Fc engineering to modulate antibody effector functions. Protein & Cell, 9(1), pp.63–73. https://doi.org/10.1007/s13238-017-0473-8.
- Fields, J. K. and Sundberg, E. J. (2023). RCSB PDB - 7LBL: Structure of Human IgG1 Fc. (online). Available at: https://www.rcsb.org/structure/7lbl.
- Teplyakov, A., et al. (2013). IgG2 Fc structure and the dynamic features of the IgG CH2–CH3 interface. Molecular Immunology, 56(1-2), pp.131–139. https://doi.org/10.1016/j.molimm.2013.03.018.
- Gohain, N., Tolbert, W. D. and Pazgier, M. (2023). RCSB PDB - 6D58: Crystal structure of a Fc fragment of Human IgG3. (online) Rcsb.org. Available at: https://www.rcsb.org/structure/6d58 (Accessed 8 Feb. 2025).
- Davies, A.M., et al. (2014). Structural Determinants of Unique Properties of Human IgG4-Fc. Journal of Molecular Biology, 426(3), pp.630–644. https://doi.org/10.1016/j.jmb.2013.10.039.
- Humphrey, W., Dalke, A. and Schulten, K. (1996). VMD: Visual molecular dynamics. Journal of Molecular Graphics, 14(1), pp.33–38. https://doi.org/10.1016/0263-7855(96)00018-5.
- Kendrick, B. S. et al. (2020). Determining Spectroscopic Quantitation Limits for Misfolded Structures. Journal of pharmaceutical sciences, (online) 109(1), pp.933–936. https://doi.org/10.1016/j.xphs.2019.09.004.
- Kresimir Sikic, Tomic, S. and Oliviero Carugo (2010). Systematic Comparison of Crystal and NMR Protein Structures Deposited in the Protein Data Bank. ˜The œOpen biochemistry journal, 4, pp.83–95. https://doi.org/10.2174/1874091x01004010083.
About ACROBiosystems
ACROBiosystems is a cornerstone enterprise of the pharmaceutical and biotechnology industries. Their mission is to help overcome challenges with innovative tools and solutions from discovery to the clinic. They supply life science tools designed to be used in discovery research and scalable to the clinical phase and beyond. By consistently adapting to new regulatory challenges and guidelines, ACROBiosystems delivers solutions, whether it comes through recombinant proteins, antibodies, assay kits, GMP-grade reagents, or custom services. ACROBiosystems empower scientists and engineers dedicated towards innovation to simplify and accelerate the development of new, better, and more affordable medicine.
Sponsored Content Policy: News-Medical.net publishes articles and related content that may be derived from sources where we have existing commercial relationships, provided such content adds value to the core editorial ethos of News-Medical.Net which is to educate and inform site visitors interested in medical research, science, medical devices and treatments.